
Characterization of a novel high-throughput, high-speed and high-precision plate-based image cytometric cell counting method
Cell & Gene Therapy Insights 2021; 7(4), 427–447
10.18609/cgti.2021.070
Bioprocessing applications for cells and biologics have dramatically increased the number of samples needed to test for cell therapy and immunotherapy. The cell counting time is a major bottleneck for traditional counting methods, which can be eliminated by using a high-throughput, high-speed, and high-precision system. Here we characterize and demonstrate the application of Cellaca™ MX high-throughput cell counter in bright field and fluorescence imaging modes. The system was subjected to multiple characterization experiments utilizing microbeads, Jurkat and CHO-S cells. We investigated the bead/cell counting consistency and precision from a count-to-count, plate-to-plate, and instrument-to-instrument level by assessing counting on multiple consumables and instruments. The precision results were acquired by directly comparing as many as 32 Cellaca™ MX instruments over an extended period of 1 year using stable bead reference samples, significantly strengthening confidence in the cell counting results. We further characterized the system under ISO Cell Counting Standard Part 2 guidance to determine the quality of the cell counting method. The system was also compared to the traditional hemocytometer and single-sample-based automatic cell counters. Finally, we demonstrate the use of Cellaca™ MX to measure a 4-log range of T cell concentrations. The Cellaca™ MX high-throughput cell counter can rapidly generate cell counts at 1 and 3 min per 24 counts in bright field and fluorescence, respectively. Its use can significantly reduce cell counting time and effectively eliminate this bottleneck for downstream assays.
Introduction
Preclinical and clinical research and development for cell therapy and immunotherapy have increased significantly in the last two decades following the approval of several checkpoint inhibitors (e.g., CTLA-4, PD-1, and PD-L1) and chimeric antigen receptor (CAR) T cell therapy (e.g., Kymriah® and Yescarta®) by the U.S. Food and Drug Administration. The rapid growth of research and production of therapeutic cells and biologics have increased the need to investigate more antibody candidates, testing conditions, and patient samples [1]Seimetz D, Heller K, Richter J. Approval of First CAR-Ts: Have we Solved all Hurdles for ATMPs? Cell Medicine 2019; 11: 1–16., [2]Vaddepally RK, Kharel P, Pandey R, Garje R, Chandra AB. Review of Indications of FDA-Approved Immune Checkpoint Inhibitors per NCCN Guidelines with the Level of Evidence. Cancers 2020; 12(3): 738..
Cell count and viability measurements are critical for research and development and the production of therapeutic cells and antibodies. For example, a higher number of conditions for media/feed optimization or other environmental variables are required for testing effects on Chinese hamster ovary (CHO) cells to optimize the quality and quantity of therapeutic biologics production. Personalized medicine such as CAR T cell therapies also require assessing an overwhelming number of patient samples. Finally, many cell-based assays with multiple conditions designed for both cell and immunotherapies require precise cell counts to properly interpret the results [3]Bartheld CSv, Bahney J, Herculano-Houzel S. The search for true numbers of neurons and glial cells in the human brain: A review of 150 years of cell counting. J. Comp. Neurol. 2016; 524(18): 3865–95., [4]Briggs C. Quality counts: new parameters in blood cell counting. Int. J. Lab. Hematol. 2009; 31(3): 277–97., [5]Väyrynen JP, Vornanen JO, Sajanti S, Böhm JP, Tuomisto A, Mäkinen MJ. An improved image analysis method for cell counting lends credibility to the prognostic significance of T cells in colorectal cancer. Virchows Archive 2012; 460: 455–6.
Increased numbers of testing conditions and cell samples can cause bottlenecks when relying on traditional cell counting technologies and methods that limit throughput and precision. Although tedious and time consuming, the manual hemocytometer has been the cell counting gold standard for over a century. In recent years, it has been slowly replaced by affordable bench-top automated cell counters [6]Chan LLY, Lai N, Wang E, Smith T, Yang X, Lin B. A rapid detection method for apoptosis and necrosis measurement using the Cellometer imaging cytometry. Apoptosis 2011; 16(12): 1295–303., [7]Berkes CA, Chan LLY, Wilkinson A, Paradis B. Rapid quantification of pathogenic fungi by Cellometer image-based cytometry. J. Microbiol. Methods 2012: 468–76., [8]Chan LL, Wilkinson AR, Paradis BD, Lai N. Rapid Image-based Cytometry for Comparison of Fluorescent Viability Staining Methods. J. Fluorescence 2012; 22(5): 1301–11.Chan LL, Wilkinson AR, Paradis BD, Lai N. Rapid Image-based Cytometry for Comparison of Fluorescent Viability Staining Methods. J. Fluorescence 2012; 22(5): 1301–11.. These image-based, single-sample cell counters can require up to 2 min/sample due to the need to manually change cell counting chambers for each run [9]Cadena-Herrera D, Lara JEE-D, Ramírez-Ibañez ND et al. Validation of three viable-cell counting methods: Manual, semi-automated, and automated. Biotechnol. Rep. 2009; 7: 9–16.Cadena-Herrera D, Lara JEE-D, Ramírez-Ibañez ND et al. Validation of three viable-cell counting methods: Manual, semi-automated, and automated. Biotechnol. Rep. 2009; 7: 9–16.Cadena-Herrera D, Lara JEE-D, Ramírez-Ibañez ND et al. Validation of three viable-cell counting methods: Manual, semi-automated, and automated. Biotechnol. Rep. 2009; 7: 9–16.. Fluidic/bright field (BF) image-based cell counters typically utilize an automatic carousel that can hold multiple samples, but they can still require up to 2 min due to the fluidics operation time [9]Cadena-Herrera D, Lara JEE-D, Ramírez-Ibañez ND et al. Validation of three viable-cell counting methods: Manual, semi-automated, and automated. Biotechnol. Rep. 2009; 7: 9–16.Cadena-Herrera D, Lara JEE-D, Ramírez-Ibañez ND et al. Validation of three viable-cell counting methods: Manual, semi-automated, and automated. Biotechnol. Rep. 2009; 7: 9–16.Cadena-Herrera D, Lara JEE-D, Ramírez-Ibañez ND et al. Validation of three viable-cell counting methods: Manual, semi-automated, and automated. Biotechnol. Rep. 2009; 7: 9–16., [10]Huang L-C, Lin W, Yagami M et al. Validation of cell density and viability assays using Cedex automated cell counter. Biologicals 2010; 38(3): 393–400., [11]Louis KS, Siegel AC. Cell Viability Analysis Using Trypan Blue: Manual and Automated Methods. In: Stoddart M (Ed.). Mammalian Cell Viability. Methods in Molecular Biology (Methods and Protocols). Volume 740: Humana Press; 20.
Cell counting consistency and precision are also critical to ensure high-quality and reproducible results. Multiple cell counting systems are used in research and development and during the manufacturing of therapeutic cell and antibody products. It is important that the same system models generate consistent and comparable results to ensure confidence in the cell counting methods [9]Cadena-Herrera D, Lara JEE-D, Ramírez-Ibañez ND et al. Validation of three viable-cell counting methods: Manual, semi-automated, and automated. Biotechnol. Rep. 2009; 7: 9–16.Cadena-Herrera D, Lara JEE-D, Ramírez-Ibañez ND et al. Validation of three viable-cell counting methods: Manual, semi-automated, and automated. Biotechnol. Rep. 2009; 7: 9–16.Cadena-Herrera D, Lara JEE-D, Ramírez-Ibañez ND et al. Validation of three viable-cell counting methods: Manual, semi-automated, and automated. Biotechnol. Rep. 2009; 7: 9–16., [12]Chen A, Leith M, Tu R, Tahim G, Sudra A, Bhargava S. Effects of diluents on cell culture viability measured by automated cell counter. PLOS One 2017; 12(3) :e0173375..
Viability staining used in the cell counting process is another important factor to consider. Trypan blue (TB) is commonly used in traditional cell counting methods, but has been shown to cause cell counting and viability variations [13]Mascotti K, McCullough J, Burger SR. HPC viability measurement: trypan blue versus acridine orange and propidium iodide. Transfusion 2000; 40: 693–6.Mascotti K, McCullough J, Burger SR. HPC viability measurement: trypan blue versus acridine orange and propidium iodide. Transfusion 2000; 40: 693–6.. Using TB with primary cells (e.g., mouse splenocytes, peripheral blood mononuclear cells) and apheresis samples that contain red blood cells, platelets, and debris can lead to high nonspecific counting [14]Chan LLY, Laverty DJ, Smith T, Nejad P, Hei H, Gandhi R, Kuksin D, Qiu J. Accurate measurement of peripheral blood mononuclear cell concentration using image cytometry to eliminate RBC-induced counting error. J. Immunol. Methods 2013; 388(1–2): 25–32.Chan LLY, Laverty DJ, Smith T, Nejad P, Hei H, Gandhi R, Kuksin D, Qiu J. Accurate measurement of peripheral blood mononuclear cell concentration using image cytometry to eliminate RBC-induced counting error. J. Immunol. Methods 2013; 388(1–2): 25–32.. TB can also rupture dead or dying primary cells, so there may be an under-counting of dead cells leading to overestimation of cell viability. Finally, TB can induce cytotoxicity when the sample is incubated for a prolonged period of time [15]Chan LL-Y, Kuksin D, Laverty DJ, Saldi S, Qiu J. Morphological observation and analysis using automated image cytometry for the comparison of trypan blue and fluorescence-based viability detection method. Cytotech. 2015; 67(3): 461–73. , [16]Chan LL-Y, Rice WL, Qiu J. Observation and quantification of the morphological effect of trypan blue rupturing dead or dying cells. PLoS One 2020; 15(1): e0227950.. In contrast, fluorescence (FL)-based counting methods using dyes such as acridine orange (AO) and propidium iodide (PI) can specifically identify nucleated cells with minimal cytotoxic effects. The ability to utilize FL-based methods for cell count and viability measurements can eliminate the issues associated with TB.
There is an urgent need to increase throughput, speed, precision, consistency, and versatility of cell counting systems to meet growing cell counting demands. In this work, we demonstrate the use of the Cellaca™ MX high-throughput cell counter (Nexcelom Bioscience, Lawrence, MA) to improve cell counting efficiency and consistency necessary for the cell and immunotherapy workflow [17]Hanamsagar R, Reizis T, Chamberlain M et al. An optimized workfow for single cell transcriptomics and repertoire profling of purifed lymphocytes from clinical samples. Sci. Rep. 2020; 10(2219)., [18]Zhu L, Yang P, Zhao Y et al. Single-Cell Sequencing of Peripheral Mononuclear Cells Reveals Distinct Immune Response Landscapes of COVID-19 and Influenza Patients. Immunity 2020; 53: 685–96.. We characterized the cell counting consistency and precision via repeated measurements using BF and FL beads on multiple lots of manufactured instruments. We performed similar consistency and precision measurements with Jurkat and CHO-S cells to mimic cell therapy and bioprocessing experiments. The recently published standardization document “ISO 20391-2:2019 Biotechnology – Cell Counting – Part 2: Experimental Design and Statistical Analysis to Quantify Counting Method Performance” (ISO Cell Counting Standards Part 2) was used to confirm quality of the cell counting result from Cellaca™ MX [19]Biotechnology – Cell counting – Part 2: Experimental design and statistical analysis to quantify counting method performance. International Organization for Standardization 20, [20]Sarkar S, Lund SP, Vyzasatya R et al. Evaluating the quality of a cell counting measurement process via a dilution series experimental design. Cytotherapy 2017; 19(12): 1509–21.Sarkar S, Lund SP, Vyzasatya R et al. Evaluating the quality of a cell counting measurement process via a dilution series experimental design. Cytotherapy 2017; 19(12): 1509–21.Sarkar S, Lund SP, Vyzasatya R et al. Evaluating the quality of a cell counting measurement process via a dilution series experimental design. Cytotherapy 2017; 19(12): 1509–21.Sarkar S, Lund SP, Vyzasatya R et al. Evaluating the quality of a cell counting measurement process via a dilution series experimental design. Cytotherapy 2017; 19(12): 1509–21., [21]Sarkar S, Pierce L, Lin-Gibson S, Lund SP. Standards Landscape in Cell Counting: Implications for Cell & Gene Therapy. Cell Gene Ther. Ins. 2019; 5(1): 117–31.Sarkar S, Pierce L, Lin-Gibson S, Lund SP. Standards Landscape in Cell Counting: Implications for Cell & Gene Therapy. Cell Gene Ther. Ins. 2019; 5(1): 117–31.. The high-throughput cell counting method was compared to results obtained with a hemocytometer and two different single-sample image-based cell counters (Cellometer Auto2000 and Vision, Nexcelom Bioscience).
The characterization, evaluation, and comparison results showed a significant improvement in speed, reducing counting time to approximately 4 and 8 min (10 and 20 s/sample) for 24 cell samples in BF and FL, respectively. The Cellaca™ MX showed high cell counting consistency and precision, as well as high cell counting quality comparable to the Celigo® Image Cytometer (Nexcelom Bioscience). The precision results were acquired by evaluating a large set of Cellaca™ MX instruments over a time-frame of 1 year, which significantly strengthens the confidence in the cell counting results. The system also measured cell concentrations that were comparable to three methodologies (hemocytometer, Cellometer® Auto2000 and Cellometer® Vision), which may provide an initial protocol for users of single-sample image-based cell counters to compare and migrate to a high-throughput system. Finally, primary T cell counting in fluorescence achieved linear results over a 4-log concentration range. These results demonstrate the capability of the Cellaca™ MX high-throughput cell counter to potentially improve upon the efficiency, consistency, and versatility of single-sample cell counters. Specifically in the cell and gene therapy sector, researchers working with multiple mouse samples, collecting PBMCs from many patients, or optimizing conditions for adeno-associated virus (AAV) production can benefit from eliminating the bottleneck of cell counting time. This platform is a valuable tool for BF- and FL-based cell counting assays that are highly applicable in the research and development workflow, as well as cell and immunotherapy product manufacturing.
Methodology
Cell culture & sample preparation
Jurkat cells (ATCC, Manassas, VA) were cultured in RPMI 1640 (Gibco, Gaithersburg, MD) supplemented with 10% fetal bovine serum (Access Biologicals, Vista, CA) and 1% penicillin-streptomycin (Gibco) in T-75 culture flasks at 37°C under 5% CO2. CHO-S cells (Gibco) were cultured in CD CHO medium supplemented with 1% GlutaMAX-1 (Gibco) and HT Supplement in T-75 culture flasks at 37°C under 8% CO2. Prior to measuring cell concentration and viability using a Cellometer® Spectrum, the Jurkat and CHO-S cells were collected directly from the flasks and stained 1:1 with 20 µL of AO/PI mixture (ViaStain™ AO/PI Staining Solution – CS2-0106-5 mL, Nexcelom Bioscience).
Cellometer® Auto2000 cell counter
The Cellometer® Auto2000 described previously utilizes one BF and two FL channels to quantitatively measure the concentration and viability of a target cell sample [22]Xu Y, Chan LL-Y, Chen S et al. Optimization of UC-MSCs cold-chain storage by minimizing temperature fluctuations using an automatic cryopreservation system. Cryobiology 2021; 99: 131–9.. The excitation (EX)/emission (EM) filter sets to detect AO/PI fluorescence for counting are 470/535 nm and 540/605 nm for the green and red channels, respectively. Target cell samples were stained 1:1 with AO/PI, pipetted (20 μL) into a Nexcelom disposable counting chamber (CHT4-SD100), and then inserted into the system to be imaged at four locations and analyzed using the default counting parameters. Image acquisition and analysis were typically < 2 min/sample.
Cellometer® Vision & Spectrum cell analyzers
The Cellometer® Vision and Spectrum were described in previous publications [23]Bieberich F, Vazquez-Lombardi R, Yermanos A et al. A single-cell atlas of lymphocyte adaptive immune repertoires and transcriptomes reveals age-related differences in convalescent COVID-19 patients. bioRxiv 2021., [24]Sun T, Zhang K, Pangeni RP et al. Histone Methyltransferase G9a Promotes Invasion of Non-small Cell Lung Cancer Through Enhancing Focaladhesionkinase Activationvia NF-KB Signaling Pathway. Research Square 2021. , [25]Zeijlemaker W, Kelder A, Cloos J, Schuurhuis GJ. Immunophenotypic Detection of Measurable Residual (Stem Cell) Disease Using LAIP Approach in Acute Myeloid Leukemia. Curr. Protoc. Cytom. 2019; 91(e66)., [26]Chan LL, Zhong XM, Qiu J, Li PY, Lin B. Cellometer Vision as an Alternative to Flow Cytometry for Cell Cycle Analysis, Mitochondrial Potential, and Immunophenotyping. Cytometry Part A 2011; 79A(7): 507–17., [27]Chan LLY, Shen D, Wilkinson AR et al. A novel image-based cytometry method for autophagy detection in living cells. Autophagy 2012; 8(9): 1371–82., [28]Chan LL-Y, Huang J, Hagiwara Y, Aguila L, Rowe D. Discriminating Multiplexed GFP Reporters in Primary Articular Chondrocyte Cultures Using Image Cytometry. J. Fluoresc. 2014; 24(4): 1041–53.; both platforms are equipped with one BF and two FL channels to quantitatively measure target cell sample concentration and viability. The interchangeable EX/EM filter sets to detect AO/PI fluorescence were 475/534 nm and 527/655 nm for the green and red channels, respectively. Target cell samples were prepared as described in the Cellometer® Auto2000. Image acquisition and analysis were typically <2 min/sample.
Celigo® Image Cytometer
The Celigo® Image Cytometer for performing high-throughput cell-based assays in standard microtiter plates was previously described [29]Chan LL-Y, Smith T, Kumph KA et al. A high-throughput AO/PI-based cell concentration and viability detection method using the Celigo image cytometry. Cytotechnology 2016; 68(5): 2015–25. Chan LL-Y, Smith T, Kumph KA et al. A high-throughput AO/PI-based cell concentration and viability detection method using the Celigo image cytometry. Cytotechnology 2016; 68(5): 2015–25. , [30]Zigon ES, Purseglove SM, Toxavidis V, Rice W, Tigges J, Chan LL-Y. A rapid single cell sorting verification method using plate-based image cytometry. Cytometry Part A 2018; 93(10): 1060–5., [31]Magnotti EL, Chan LL-Y, Zhu Q, Marasco WA. A high-throughput chemotaxis detection method for CCR4+ T cell migration inhibition using image cytometry. J. Immunol. Methods 2020; 112747., [32]Maldini CR, Love AC, Tosh KW et al. Characterization of CAR T cell expansion and cytotoxic potential during Ex Vivo manufacturing using image-based cytometry. J. Immunol. Meth. 2020; 484–485: 112830., [33]Wang Y, Chan LL-Y, Grimaud M, Fayed A, Zhu Q, Marasco WA. High-Throughput Image Cytometry Detection Method for CAR-T Transduction, Cell Proliferation, and Cytotoxicity Assays. Cytometry Part A 2020:; it has one BF and four FL imaging channels in blue (EX: 377/50 nm, EM: 470/22 nm), green (EX: 483/32 nm, EM: 536/40 nm), red (EX: 531/40 nm, EM: 629/53 nm), and far red (EX: 628/40 nm, EM: 688/31 nm).
The Celigo® software application “Expression: Target 1 + 2” was used to directly count AO-stained Jurkat and CHO-S cells in the Cellaca™ plate with a 12 x 2 Cellaca™ plate profile. The instrument was set up to acquire images in Target 1 (BF) and Target 2 (Green) with the AO exposure time for set to 4,000 μs. Hardware-based autofocus was used to focus in the BF channel, and focus offsets were applied for the Green (+26 μm) channel.
The preset ANALYZE parameters were optimized to automatically count cells but disregard debris and nonspecific particles. For AO-stained Jurkat cells and CHO-S cells, the ANALYZE parameters for the green channel are shown in Supplementary Table 1. The ANALYZE parameters for the BF channel are also shown in Supplementary Table 1. The BF channel was used for visualization and not analyzed. The counting results were exported into an EXCEL (Microsoft Corp., Redmond, WA) template to directly calculate the respective cell concentrations.
Cellaca™ MX high-throughput cell counter
Cell counting typically involves analyzing a sample of the suspension from a much larger volume; the inherent variability in the number of cells captured in each analyzed volume is a source of random variation among replicate counts. For a typical cell counting process, sampling variation usually leads to higher CVs among replicate counts for lower-concentration cell suspensions. This random error, also known as Poisson noise or shot noise, is included in the count-to-count precision. Other sources of variation can occur with slight variations in counting chamber dimensions leading to variations in analyzed sample volume. The cell counting assay precision for count-to-count or intra-plate precision can be described as the amount of variation that a user can expect for the same cell sample counted on a single instrument with a single plate.
The Cellaca™ MX FL5 high-throughput cell counter utilizes one BF, four EX (365, 470, 527, and 620 nm), and five EM (452, 534, 605, 655, and 692 nm) filter combinations. The optical system uses an epi-fluorescence setup with an imaging resolution at approximately 1.27 µm2/pixel. Target cell samples were stained 1:1 with either TB, AO, or AO/PI directly in the mixing wells on the Cellaca™ plates. Next, 50 μL of the stained cell samples were transferred into the loading wells on the Cellaca™ plates in either a 3 x 8 (CHM24-B100-020) or 12 x 2 (CHM24-A100-020) format with a total of 24 sample chambers. The plate was then inserted into the high-throughput cell counting system for image acquisition and analysis. The default cell counting analysis algorithms were selected for TB, AO, or AO/PI to count cells and measure viability. The system can image and analyze 24 samples in BF and FL at 1 and 3 min, respectively, without autofocusing. With autofocus the corresponding times were 4 and 8 min. The results were compared to those obtained with the Cellometer® Auto2000, Vision, and Celigo® Image Cytometer.
UV-cured bead reference plates
Stable and robust reference samples for evaluating counting performance were prepared using microbeads and UV-curing polymer. Three types of microbeads were used: a non-fluorescent 5.0-μm poly latex microbead product (SPI Supplies, West Chester, PA), and a mixture of 70% green (Dragon Green, 7.5-μm) and 30% red fluorescent (Envy Green, 10-μm) microbeads from Bangs Laboratories Inc. (Fishers, IN). Microbead suspensions were left to evaporate inside conical tubes. After the microbeads were dried, approximately 2–3 mL of viscous UV-curable polymer solution was added to the conical tubes that were conical tubes that were then wrapped in black fabric for light protection and rotated for up to 3 weeks on a rotisserie-style tube rotator (RKVS, Laurel, MD) to resuspend the beads. Small metal weights were added to the tubes to remove beads stuck to the sides. After resuspension, the concentration of the beads was diluted by adding more UV-curable polymer. The final bead solutions were pipetted into the loading wells of the Cellaca™ plates and allowed to flow into the counting chambers via capillary action. The filled plates were then illuminated with high-intensity UV light for 30 s to cure the optically clear polymer and lock the beads into place. The finished plates were stored in the dark to prevent potential photo-damage to the beads.
UV-cured bead counting consistency & precision in BF
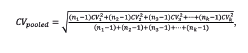
Four UV-cured reference plates (Cellaca™ plates 12 x 2) were prepared with non-fluorescent beads at two concentrations (5 x 10⁶ beads/mL and 1 x 10⁶ beads/mL, 2 plates each). The BF UV-cured reference plates were analyzed on 32 Cellaca™ MX instruments manufactured over 10 months. In a separate experiment, one of the plates was analyzed 20 times in succession on a single instrument to obtain the analysis-to-analysis and scan-to-scan variation for this assay.
CHO cell counting consistency & precision in BF
A 600-μL aliquot of CHO-S cells was collected and mixed in a microtube with 600 μL of 0.2% TB solution (STEMCELL Technologies, Vancouver, Canada). The resulting 1.2 mL of TB-stained cell sample was used to fill 20 Cellaca™ plate counting chambers, divided evenly between 2 Cellaca™ plates at 50 μL/well. Both plates were immediately imaged and analyzed on 5 Cellaca™ MX instruments in rapid succession, for a total of 100 measurements. All instruments used identical counting parameters as defined in the default Cellaca™ assay for “CHO Trypan Blue Viability.”
UV-cured bead counting consistency & precision in FL
Pilot experiments revealed that the green fluorescent beads were significantly brighter than red, thus green beads were used in the remainder of this study. Two UV-cured reference plates (Cellaca plates 12 x 2) were prepared with a 6-point dilution series of the fluorescent bead mixture with four replicates for each dilution. It is important to note that the viscosity of the UV curable polymer solution prevented precise dilution ratios. The highest and lowest concentrations of green beads were ~5 x 10⁶ beads/mL and 1.5 x 10⁵ beads/mL, respectively. The two reference plates were measured in 13 Cellaca™ MX instruments manufactured over 6 months. In a later experiment, one of the plates was analyzed 20 times on a single instrument for investigation of the analysis-to-analysis and scan-to-scan precision.
Jurkat cell counting consistency & precision in FL
A 600-μL aliquot of Jurkat cells was collected and mixed 1:1 with the AO/PI solution. The resulting 1.2 mL of AO/PI-stained cell sample was used to fill 20 Cellaca™ plate counting chambers, divided evenly between 2 Cellaca™ plates at 50 μL/well. Both plates were immediately imaged and analyzed on the same five Cellaca™ MX instruments used for the CHO experiment. The instruments were used in FL mode using the built-in AO/PI viability assay with default counting parameters.
To calculate cell counting precision, the same experiment was performed nine additional times on different days, with two to four instruments included in each experiment. Including those used in the 5-instrument experiment, 15 unique instruments were employed in the study. The Jurkat cell concentration ranged from 5 x 10⁵ to 2.75 x 10⁶ cells/mL, with viability ranging from 25% to 100%.
Bead & cell counting consistency & precision calculations
Counting assay precision from count to count in each experiment was calculated for each plate/instrument combination separately, and the resulting coefficients of variation (CVs) were pooled following the equation:
where nk is the number of measurements of the kth experiment, and CVk is their CV. Counting assay precision from plate to plate was calculated by averaging all measurements for each plate and calculating the CV for the resulting plate averages (n = 2/experiment). The results for the 10 experiments were then pooled in the same way. Counting assay precision from instrument to instrument was similarly calculated. System-wide cell counting precision was defined as the CV for the entire collection of data for each cell sample, including all wells, plates, and instruments. The resulting CVs for the 10 experiments were then pooled as before. We did not correct for the dependence of variation on cell concentration; rather, all CVs were weighted equally in our pooling, regardless of concentration. Counting assay precision from scan to scan was calculated by pooling the CVs of 24 wells (BF) and 6 concentration groups of 4 wells (FL), with each well scanned 20 times on the same instrument. The precision for analysis to analysis was performed by reanalyzing the same images 20 times and calculating the pooled CV.
Comparison of Cellaca™ MX to hemocytometer in BF
Three 15-mL conical tubes were each filled with ∼10 mL of non-fluorescent 5-μm poly latex beads in water at a concentration of ∼2 x 10⁶ beads/mL. The bead concentration in each tube was measured by a trained operator using a standard hemocytometer and a light microscope. Forty manual counts were performed for each tube, each consisting of four squares on the hemocytometer. Next, each tube was used to fill all 24 wells in 6 Cellaca™ plates (total of 144 Cellaca™ counting chambers) and counted on the Cellaca™ MX using the BF concentration assay, with the contrast parameter increased to 0.6.
In addition, 3 samples of high viability CHO cells were collected from culture at ∼2 x 10⁶ cells/mL and 0.5 x 10⁶ cells/mL. The CHO cell samples were stained 1:1 with TB at 50 µL in the mixing wells on the Cellaca™ plates, and subsequently loaded into 24 loading wells. Up to 4 samples were manually counted using the hemocytometer.
Comparison of Cellaca™ MX to Cellometer® Vision & Cellometer® Auto2000 in FL
Jurkat cells were prepared in three conical tubes at approximate concentrations of 6 x 10⁵, 1.2 x 10⁶, and 1.9 x 10⁶ cells/mL in a volume of 4–7 mL/tube and gently rotated using a tube rotator. The initial cell concentrations were measured by staining cells with AO/PI and directly counting in Cellometer® Auto2000. The Jurkat cell suspensions were analyzed sequentially, with all measurements for one tube completed before proceeding to the next concentration. For each series of measurements, the conical tube was gently inverted five times, and a 15-μL cell sample was immediately aliquoted and mixed 1:1 with AO/PI. After staining, 20 μL was loaded into one of the two counting chambers in a Nexcelom cell counting slide. The staining and loading procedures were repeated to prepare 12 chambers on 6 slides. Jurkat cells from the same tube were then used to fill 12 counting chambers on a Cellaca™ plate by mixing 50 μL of cells with 50 μL of AO/PI in the mixing well, and then transferring 50 μL of stained cells into the loading well.
The prepared slides were imaged and analyzed using two Cellometer® Auto2000 and two Cellometer® Vision instruments. The prepared plates were imaged and analyzed using two Cellaca™ MX instruments. Green and red FL channels were used for all instruments with identical exposure and cell counting settings on both instruments of each type.
ISO Cell Counting Standards Part 2
The ISO Cell Counting Standards Part 2 protocol was used to compare the cell counting performances of the Cellaca™ MX and Celigo® Image Cytometer. The Bland-Altman comparative method was also used to assess statistical bias between the two cell counting methods [34]Altman DG, Bland JM. Measurement in Medicine: The Analysis of Method Comparison Studies. The Statistician 1983; 32(3): 307–17.Altman DG, Bland JM. Measurement in Medicine: The Analysis of Method Comparison Studies. The Statistician 1983; 32(3): 307–17., [35]Bland JM, Altman DG. Statistical Methods For Assessing Agreement Between Two Methods of Clinical Measurement. The Lancet 1986; 327(8476): 307–10.Bland JM, Altman DG. Statistical Methods For Assessing Agreement Between Two Methods of Clinical Measurement. The Lancet 1986; 327(8476): 307–10., [36]Carkeet A. A Review of the Use of Confidence Intervals for Bland-Altman Limits of Agreement in Optometry and Vision Science. Optom. Vis. Sci. 2020; 97(1): 3–8., [37]Tholudur A, Giron L, Alam K et al. Comparing Automated and Manual Cell Counts for Cell Culture Applications. BioProcess Int. 2006.Tholudur A, Giron L, Alam K et al. Comparing Automated and Manual Cell Counts for Cell Culture Applications. BioProcess Int. 2006..
After sample preparation, Jurkat and CHO-S cells were collected into two separate 15-mL conical tubes and adjusted to ~5 x 10⁶ cells/mL to produce the stock concentration for use in the ISO Cell Counting Standards Part 2. Next, cell samples with different dilution fractions (DF: 1.0, 0.9, 0.7, 0.5, 0.3, 0.1) were produced independently from the stock cell samples (n = 3 per DF), and then stained 1:1 with AO (ViaStain™ AO Staining Solution – CS1-0108-5mL, Nexcelom Bioscience) in microtubes. The stained cell sample from the first microtube of each DF sample was pipetted into the first Cellaca™ plate (n = 4 per plate). Once prepared, the first plate was immediately imaged and analyzed using the Cellaca™ MX and Celigo® Image Cytometer. The second and third Cellaca™ plates were prepared, imaged, and analyzed following the same procedure. A total of 12 observations were conducted per DF sample in these 3 plates. For AO-stained Jurkat cells, the Cellaca™ MX analysis parameters for the green channel were set to: “Min Diameter = 3,” “Max Diameter = 25,” “Roundness = 0.1,” and “Intensity Threshold = 15.” For AO-stained CHO-S cells, the ANALYZE parameters for the green channel were set to: “Min Diameter = 2,” “Max Diameter = 40,” “Roundness = 0,” and “Intensity Threshold = 20.” The cell counting and concentration results were analyzed using an in-house developed software program to calculate the coefficient of determination (R2), pooled CV for each DF sample, and proportionality index (PI) as indicated in the ISO Cell Counting Standards Part 2. The results were directly compared using the Bland-Altman comparative analysis method to determine the bias, limits of agreement (LoAs), and bias confidence interval (CI).
Bland-Altman statistical analysis
Cell counting methods were compared using mean-difference or Bland-Altman plots [34]Altman DG, Bland JM. Measurement in Medicine: The Analysis of Method Comparison Studies. The Statistician 1983; 32(3): 307–17.Altman DG, Bland JM. Measurement in Medicine: The Analysis of Method Comparison Studies. The Statistician 1983; 32(3): 307–17., [35]Bland JM, Altman DG. Statistical Methods For Assessing Agreement Between Two Methods of Clinical Measurement. The Lancet 1986; 327(8476): 307–10.Bland JM, Altman DG. Statistical Methods For Assessing Agreement Between Two Methods of Clinical Measurement. The Lancet 1986; 327(8476): 307–10.. Because the variance of replicate cell counting measurements is typically proportional to the mean concentration, we adopted the use of percent differences rather than absolute differences for the vertical axis of the plot [37]Tholudur A, Giron L, Alam K et al. Comparing Automated and Manual Cell Counts for Cell Culture Applications. BioProcess Int. 2006.Tholudur A, Giron L, Alam K et al. Comparing Automated and Manual Cell Counts for Cell Culture Applications. BioProcess Int. 2006.. The bias of one measurement method relative to the other is calculated by averaging the percent differences across all concentrations. The LoAs are calculated to contain approximately 95% of the percent differences, using the sample standard deviation as an approximation for the population standard deviation. Dividing the LoA by the square root of the number of samples produces an approximate 95% CI on the bias. If the value of zero fell within the bounds of this CI, the bias was deemed insignificant.
Application of high-throughput T cell counting
The T cell culture used in this experiment was a kind gift from a current collaborator. Cells were collected from eight T-25 culture flasks and pooled together in a 50-mL conical tube at a total volume of 40 mL. The cells were then centrifuged at 1200 RPM for 10 min and resuspended in 1.5 mL of RPMI media to a concentration of approximately 3.5 x 10⁷ cells/mL. Fifteen dilutions were generated in microtubes by performing 1:2 serial dilutions with RPMI media. These serial dilutions translated down to a 1:16,384 DF of the original sample. An equal volume of AO/PI (500 μL) was added to each dilution to generate a 1:1 staining of the cell samples (500 μL) in the Cellaca™ plate mixing wells (12 x 2 format). Four replicates of 50 μL of the stained cell samples were directly transferred into loading wells for each dilution for a total of 60 counting chambers on 3 Cellaca™ plates. Prior to performing any dilutions, sample transfers, or sub-sampling to generate replicates, each tube was gently vortexed to minimize cell settling and ensure uniform distribution. Each plate was inserted into the Cellaca™ MX high-throughput cell counter for image acquisition and analysis using the built-in AO/PI viability assay with default counting parameters.
Results & discussion
Variation & precision considerations in cell counting methods
In accordance with the ISO Cell Counting Standards guidelines, evaluating a cell counting method is specific to the entire process including cell type, cell suspension, mixing, aliquoting, sample preparation, reagents, consumables, instruments, algorithms, parameters, and every step from the original cell culture flask or sample tube to the final data on the screen. A change at any point may lead to significant performance differences, and the new process may be considered as a unique cell counting method to be separately evaluated. It is therefore important to define the intended purpose and scope of a cell counting method evaluation. For example, if the purpose is to determine the expected precision, then the evaluation experiments should include all variation sources expected for the cell counting method (e.g., multiple operators, instruments, days, reagent lots, etc.). In this context, our results should only be viewed as examples of cell counting method evaluations rather than strict method performance predictions. We considered precision on several levels including count-to-count, plate-to-plate, instrument-to-instrument, and system-wide, which will be briefly described for each level of precision.
Slight cell counting chamber differences can also exist between the Cellaca™ plates, which is an additional source of variation for experiments involving multiple plates. The cell counting assay precision for plate-to-plate or inter-plate precision is estimated by averaging all other experimental variables to determine plate consistency. Similarly, measuring the same sample on two different instruments can yield slightly different average results. The cell counting assay precision for instrument-to-instrument is the variation expected when a single cell sample is measured on multiple instruments.
The various error sources do not add linearly; rather, they partially cancel each other, leading to an overall CV that is smaller than the sum. System-wide cell counting precision is the expected variation when repeated measurements are made of a cell sample using a random chamber in a random plate on a random instrument, which is determined by including all sources of variation. The system-wide precision gives an indication of the confidence a user can have that a cell counting result is close to the ‘true’ value, although accuracy cannot be defined due to the lack of a true live cell reference standard [20]Sarkar S, Lund SP, Vyzasatya R et al. Evaluating the quality of a cell counting measurement process via a dilution series experimental design. Cytotherapy 2017; 19(12): 1509–21.Sarkar S, Lund SP, Vyzasatya R et al. Evaluating the quality of a cell counting measurement process via a dilution series experimental design. Cytotherapy 2017; 19(12): 1509–21.Sarkar S, Lund SP, Vyzasatya R et al. Evaluating the quality of a cell counting measurement process via a dilution series experimental design. Cytotherapy 2017; 19(12): 1509–21.Sarkar S, Lund SP, Vyzasatya R et al. Evaluating the quality of a cell counting measurement process via a dilution series experimental design. Cytotherapy 2017; 19(12): 1509–21., [21]Sarkar S, Pierce L, Lin-Gibson S, Lund SP. Standards Landscape in Cell Counting: Implications for Cell & Gene Therapy. Cell Gene Ther. Ins. 2019; 5(1): 117–31.Sarkar S, Pierce L, Lin-Gibson S, Lund SP. Standards Landscape in Cell Counting: Implications for Cell & Gene Therapy. Cell Gene Ther. Ins. 2019; 5(1): 117–31., [38]Biotechnology — Cell counting — Part 1: General guidance on cell counting methods. International Organization for Standardization 2018..
One major strength of the work presented here is the high number of Cellaca™ MX instruments evaluated over an extended period of time, showing not only high repeatability, but high intermediate precision as described in the ICH Q2 (R1) guidance document [39]Validation of Analytical Procedures: Text and Methodology Q2(R1). In: Guideline IHT; 2005.Validation of Analytical Procedures: Text and Methodology Q2(R1). In: Guideline IHT; 2005.. It is also important to point out that the precision level required for cell counting is based on the ‘fit-for-purpose’ principle described in the ISO Cell Counting Standard Part 1, which is dependent on the intended purpose of the cell counting results.
Cell counting variation & precision characterization in BF
The BF cell analysis capabilities of the Cellaca™ MX were characterized by counting UV-cured beads and TB-stained CHO cells on multiple instruments. It is important to note that a small sample of instruments may happen to be much more or less consistent than the general instrument population. We therefore included as many instruments as possible to best characterize the cell counting assay precision on an instrument-to-instrument level. Such experiments can be difficult due to sample instability; cell suspensions can degrade over the course of a long experiment, and even microbead solutions may evaporate from counting chambers. To overcome these problems, we created stable reference plates consisting of microbeads locked in optically transparent UV-curable polymers. We performed bead counting using 32 Cellaca™ MX instruments manufactured over 10 months. The counting results are presented in Figure 1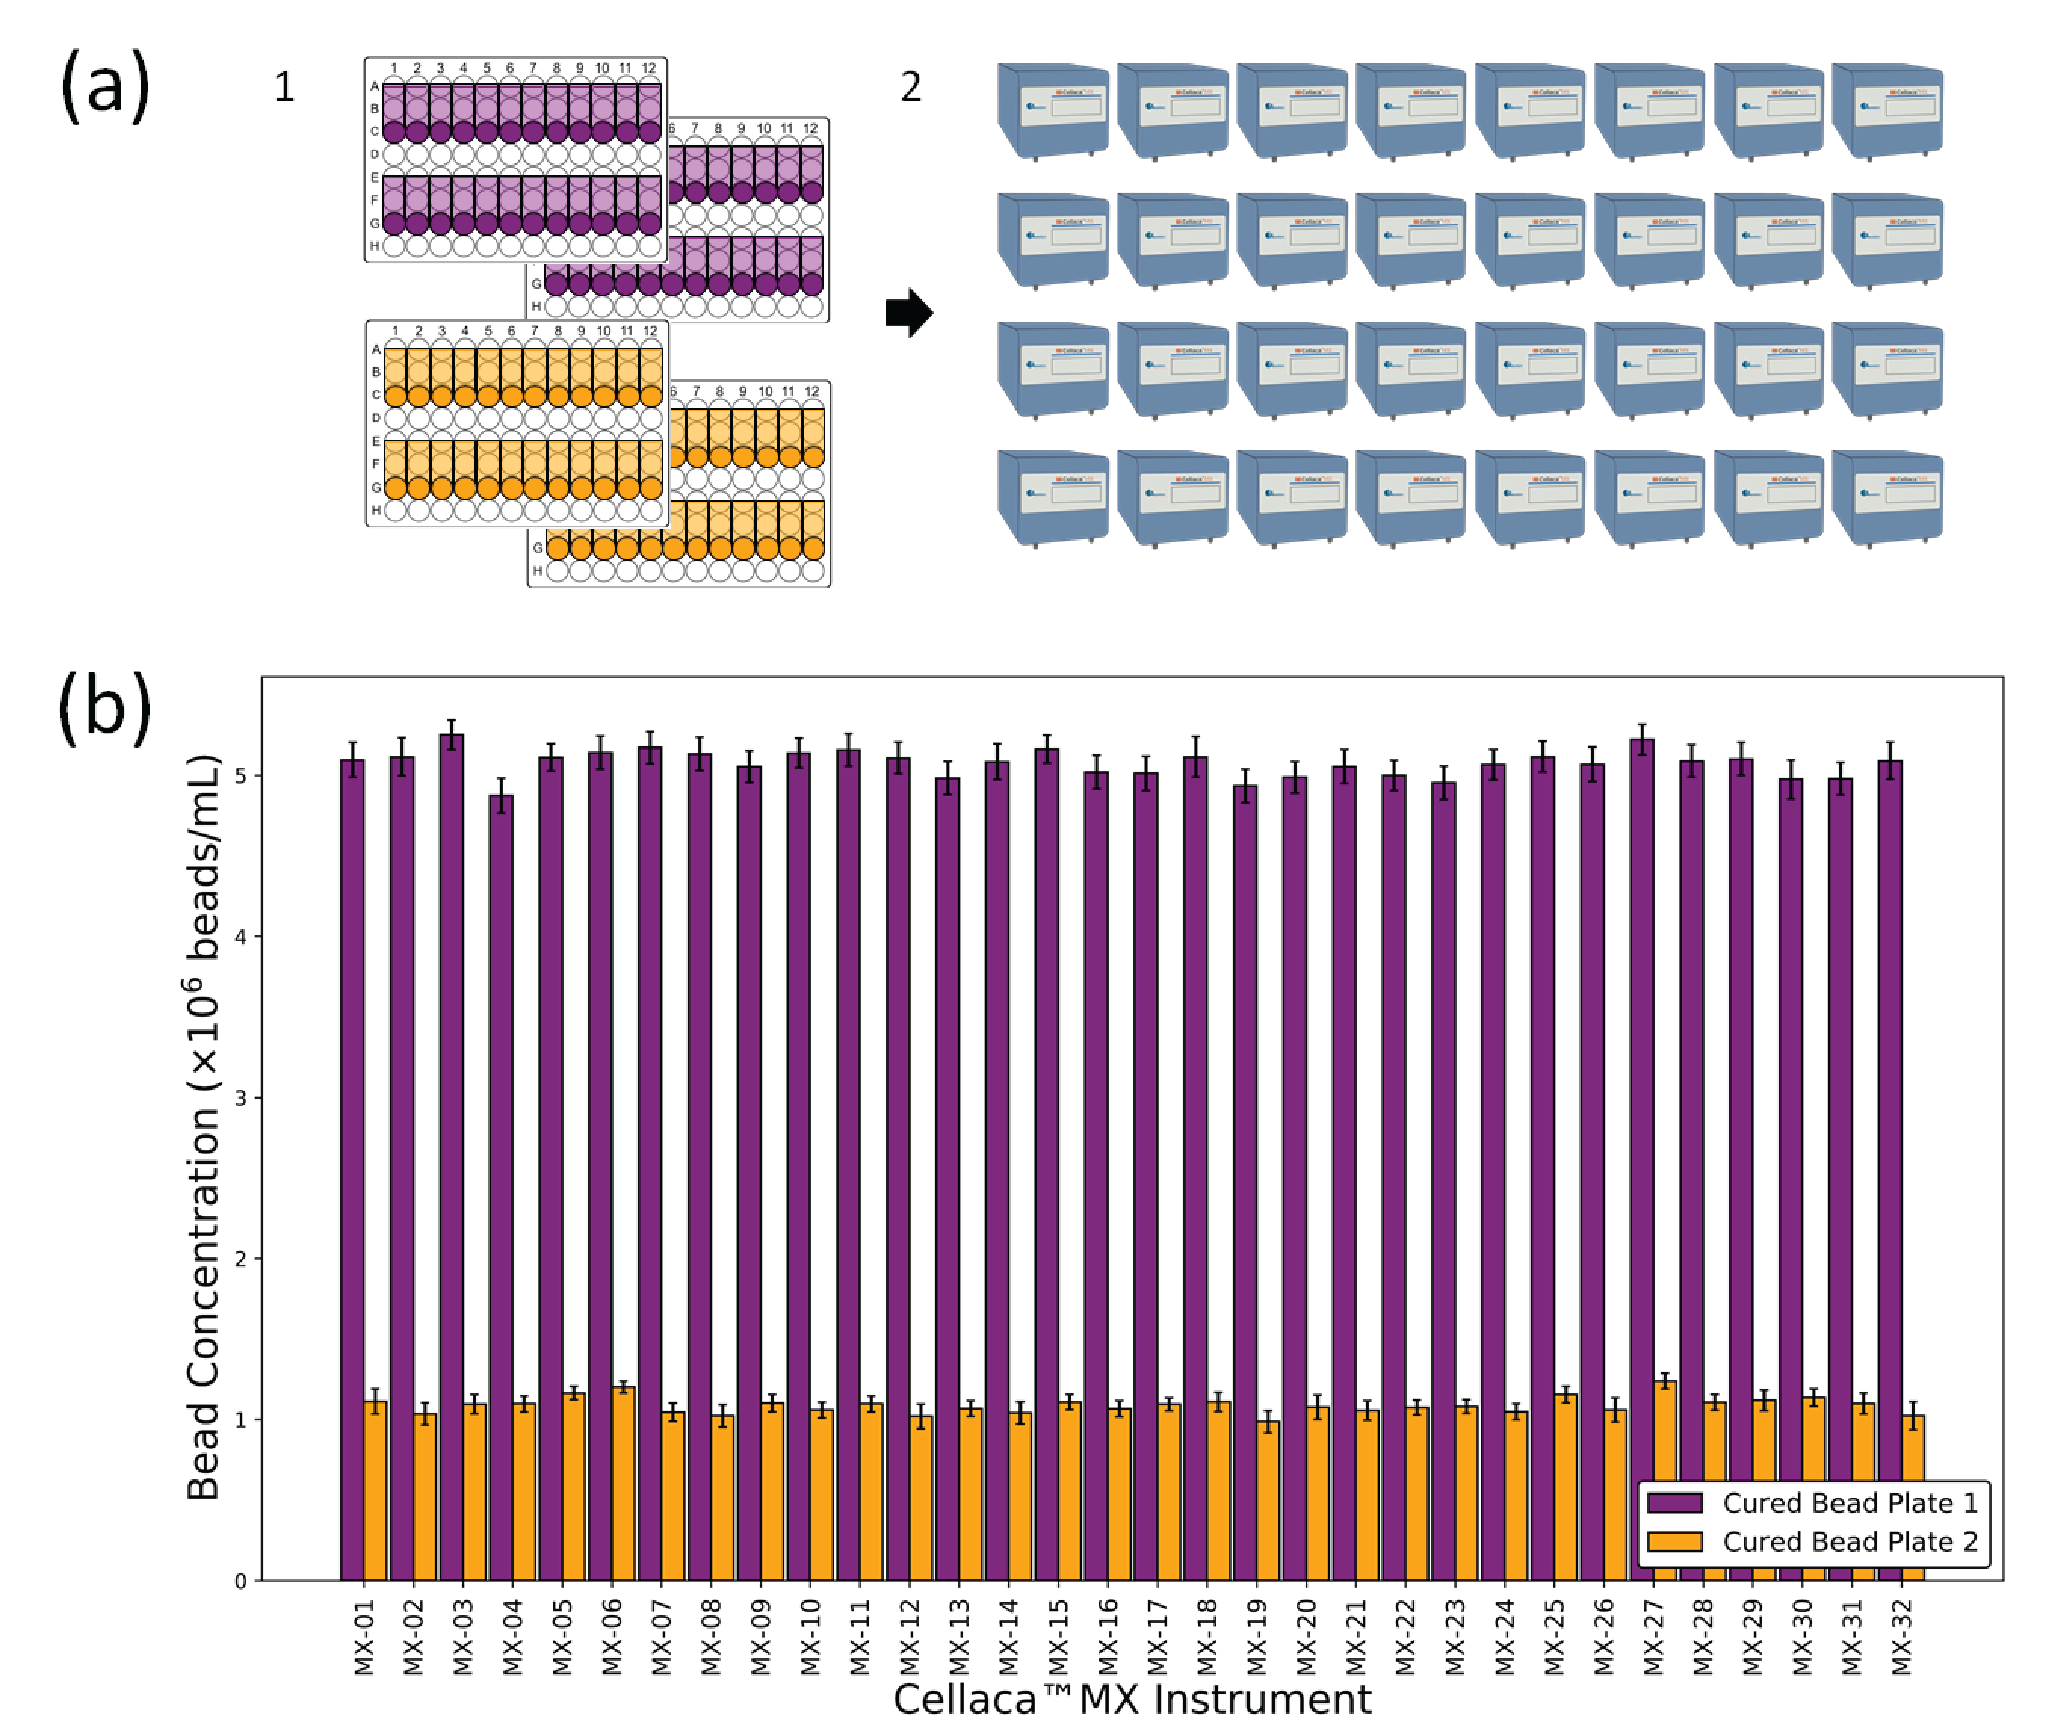
| Table 1 Bead counting consistency and precision characterization results for BF applications. | ||
| Precision level | Beads total conc. (CV) | |
| 4.9 x 10⁶ beads/mL | 1.1 x 10⁶ beads/mL | |
| Analysis-to-analysis | 0.0% | 0.0% |
| Scan-to-scan | 1.0% | 0.5% |
| *Count-to-count | 4.2% | 5.6% |
| Plate-to-plate | 1.6% | 3.3% |
| Instrument-to-instrument | 3.6% | 4.9% |
| *System-wide | 5.7% | 7.6% |
| *The count-to-count and system-wide variation include random error and sample preparation error. | ||
One of the most common BF cell counting applications used in bioprocessing and cell line development is the TB exclusion assay for CHO and HEK293 cells. It is used to assess target cell viability based on cell membrane permeability, where live cells appear as objects with bright centers and dead cells are dark and diffuse. We investigated TB assay precision using the Cellaca™ MX by measuring the same TB-stained CHO-S cell sample on five instruments. The counting and precision results for live cell concentration and viability are shown in Figure 2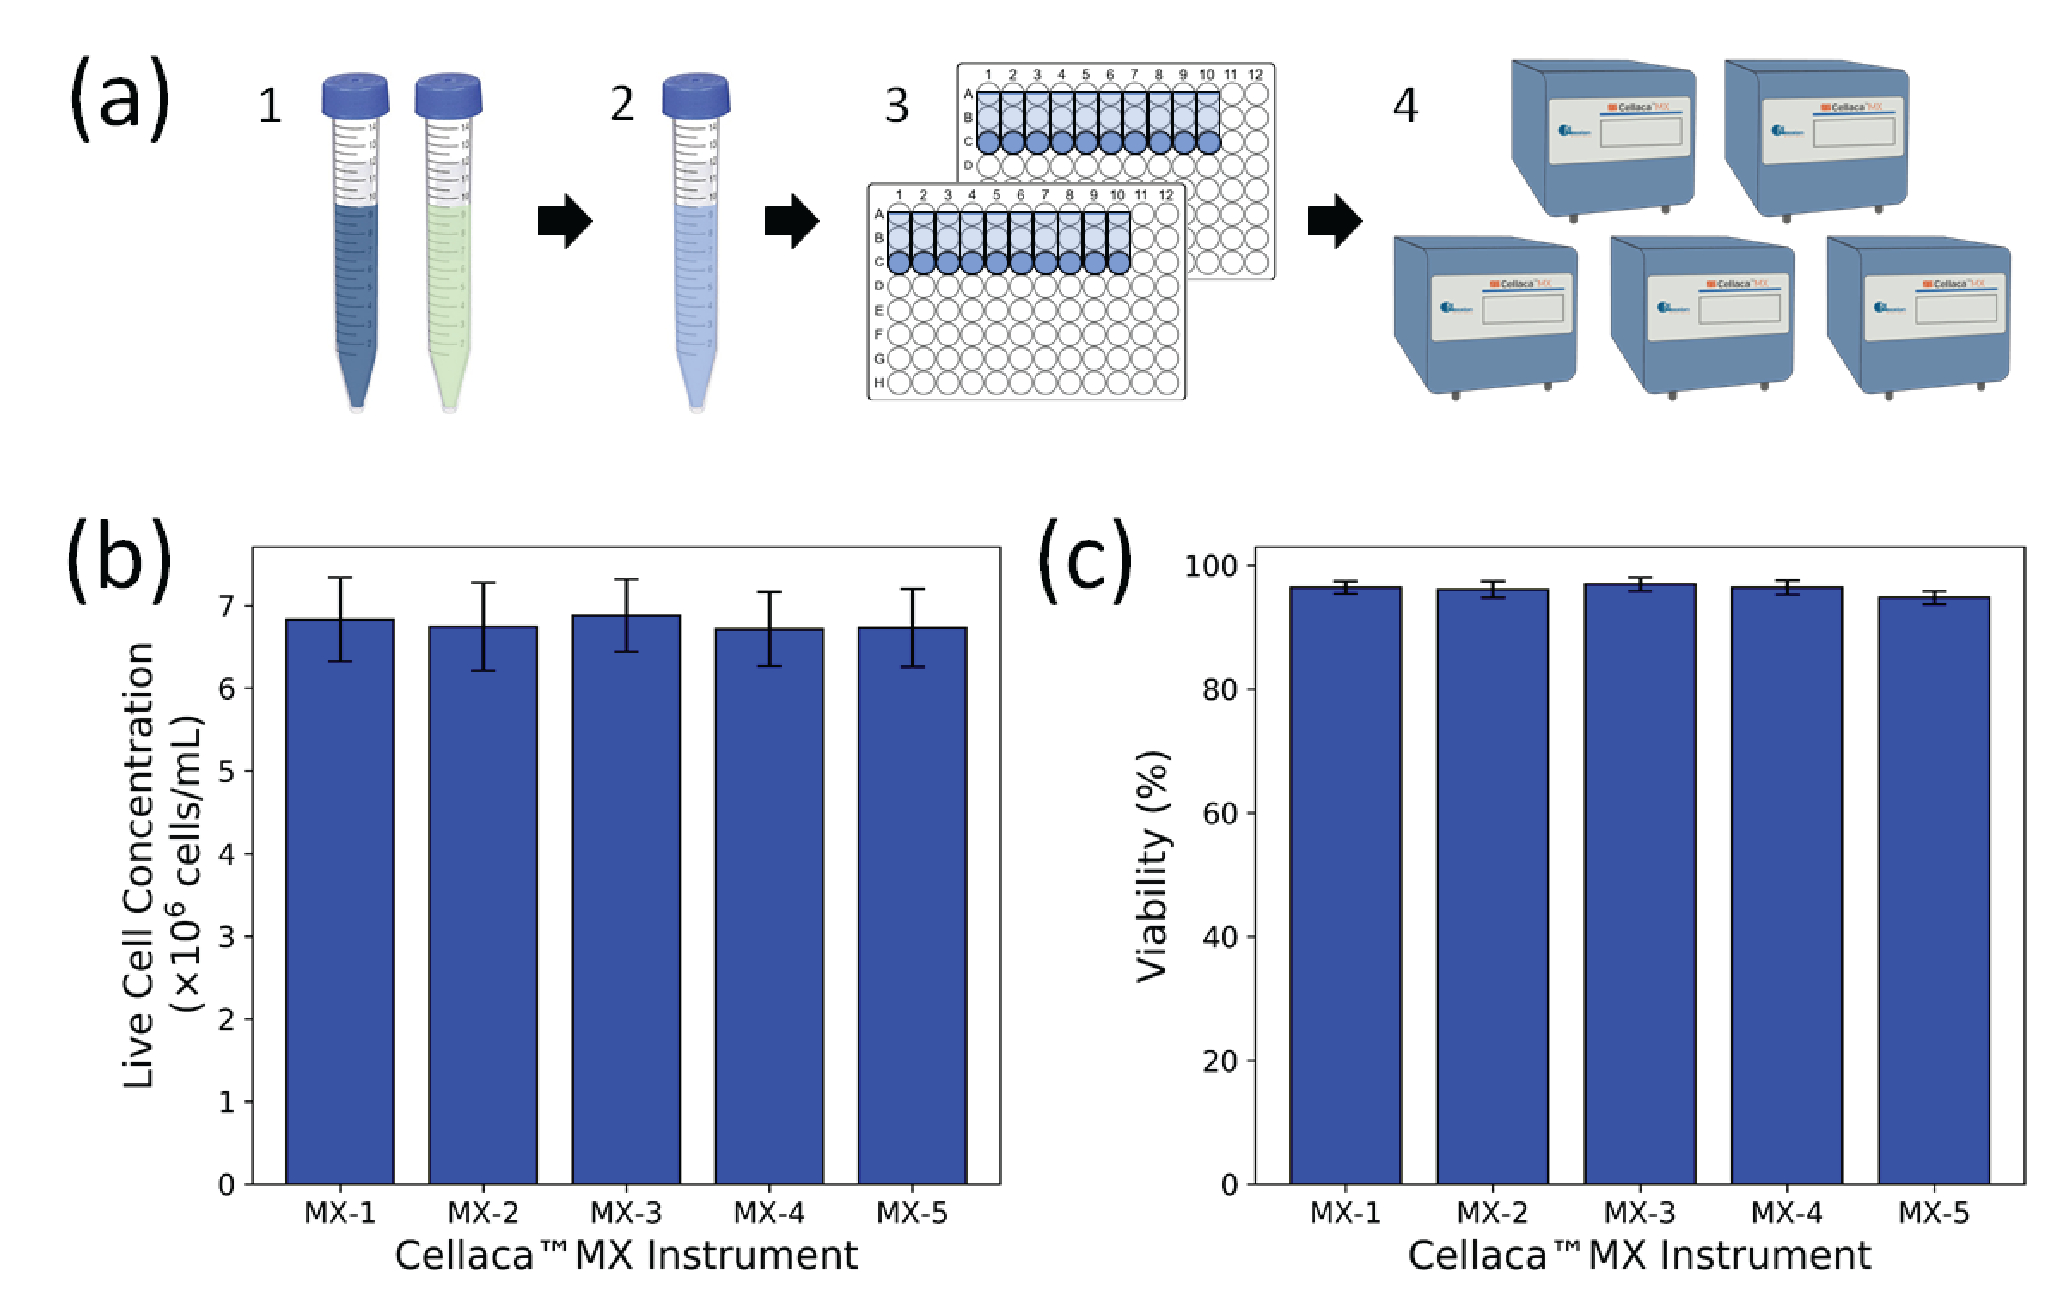
| Table 2 CHO cell counting and viability precision characterization results in BF. | |||
| Precision level | CHO total conc. (CV) | CHO live conc. (CV) | CHO viability (CV) |
| *Count-to-count | 5.5% | 5.7% | 0.9% |
| Plate-to-plate | 3.4% | 3.2% | 0.3% |
| Instrument-to-instrument | 1.7% | 2.0% | 0.7% |
| *System-wide | 7.0% | 7.3% | 1.3% |
| *The count-to-count and system-wide variation include random error and sample preparation error. | |||
Cell counting variation & precision characterization in FL
A similar procedure was used to characterize Cellaca™ MX performance for FL applications. Stable fluorescent bead reference plates were created in six concentrations ranging from 1.5 x 10⁵ to 5 x 10⁶ beads/mL and measured in 13 Cellaca™ MX instruments over a period of 6 months. The cell counting and precision results are presented in Figure 3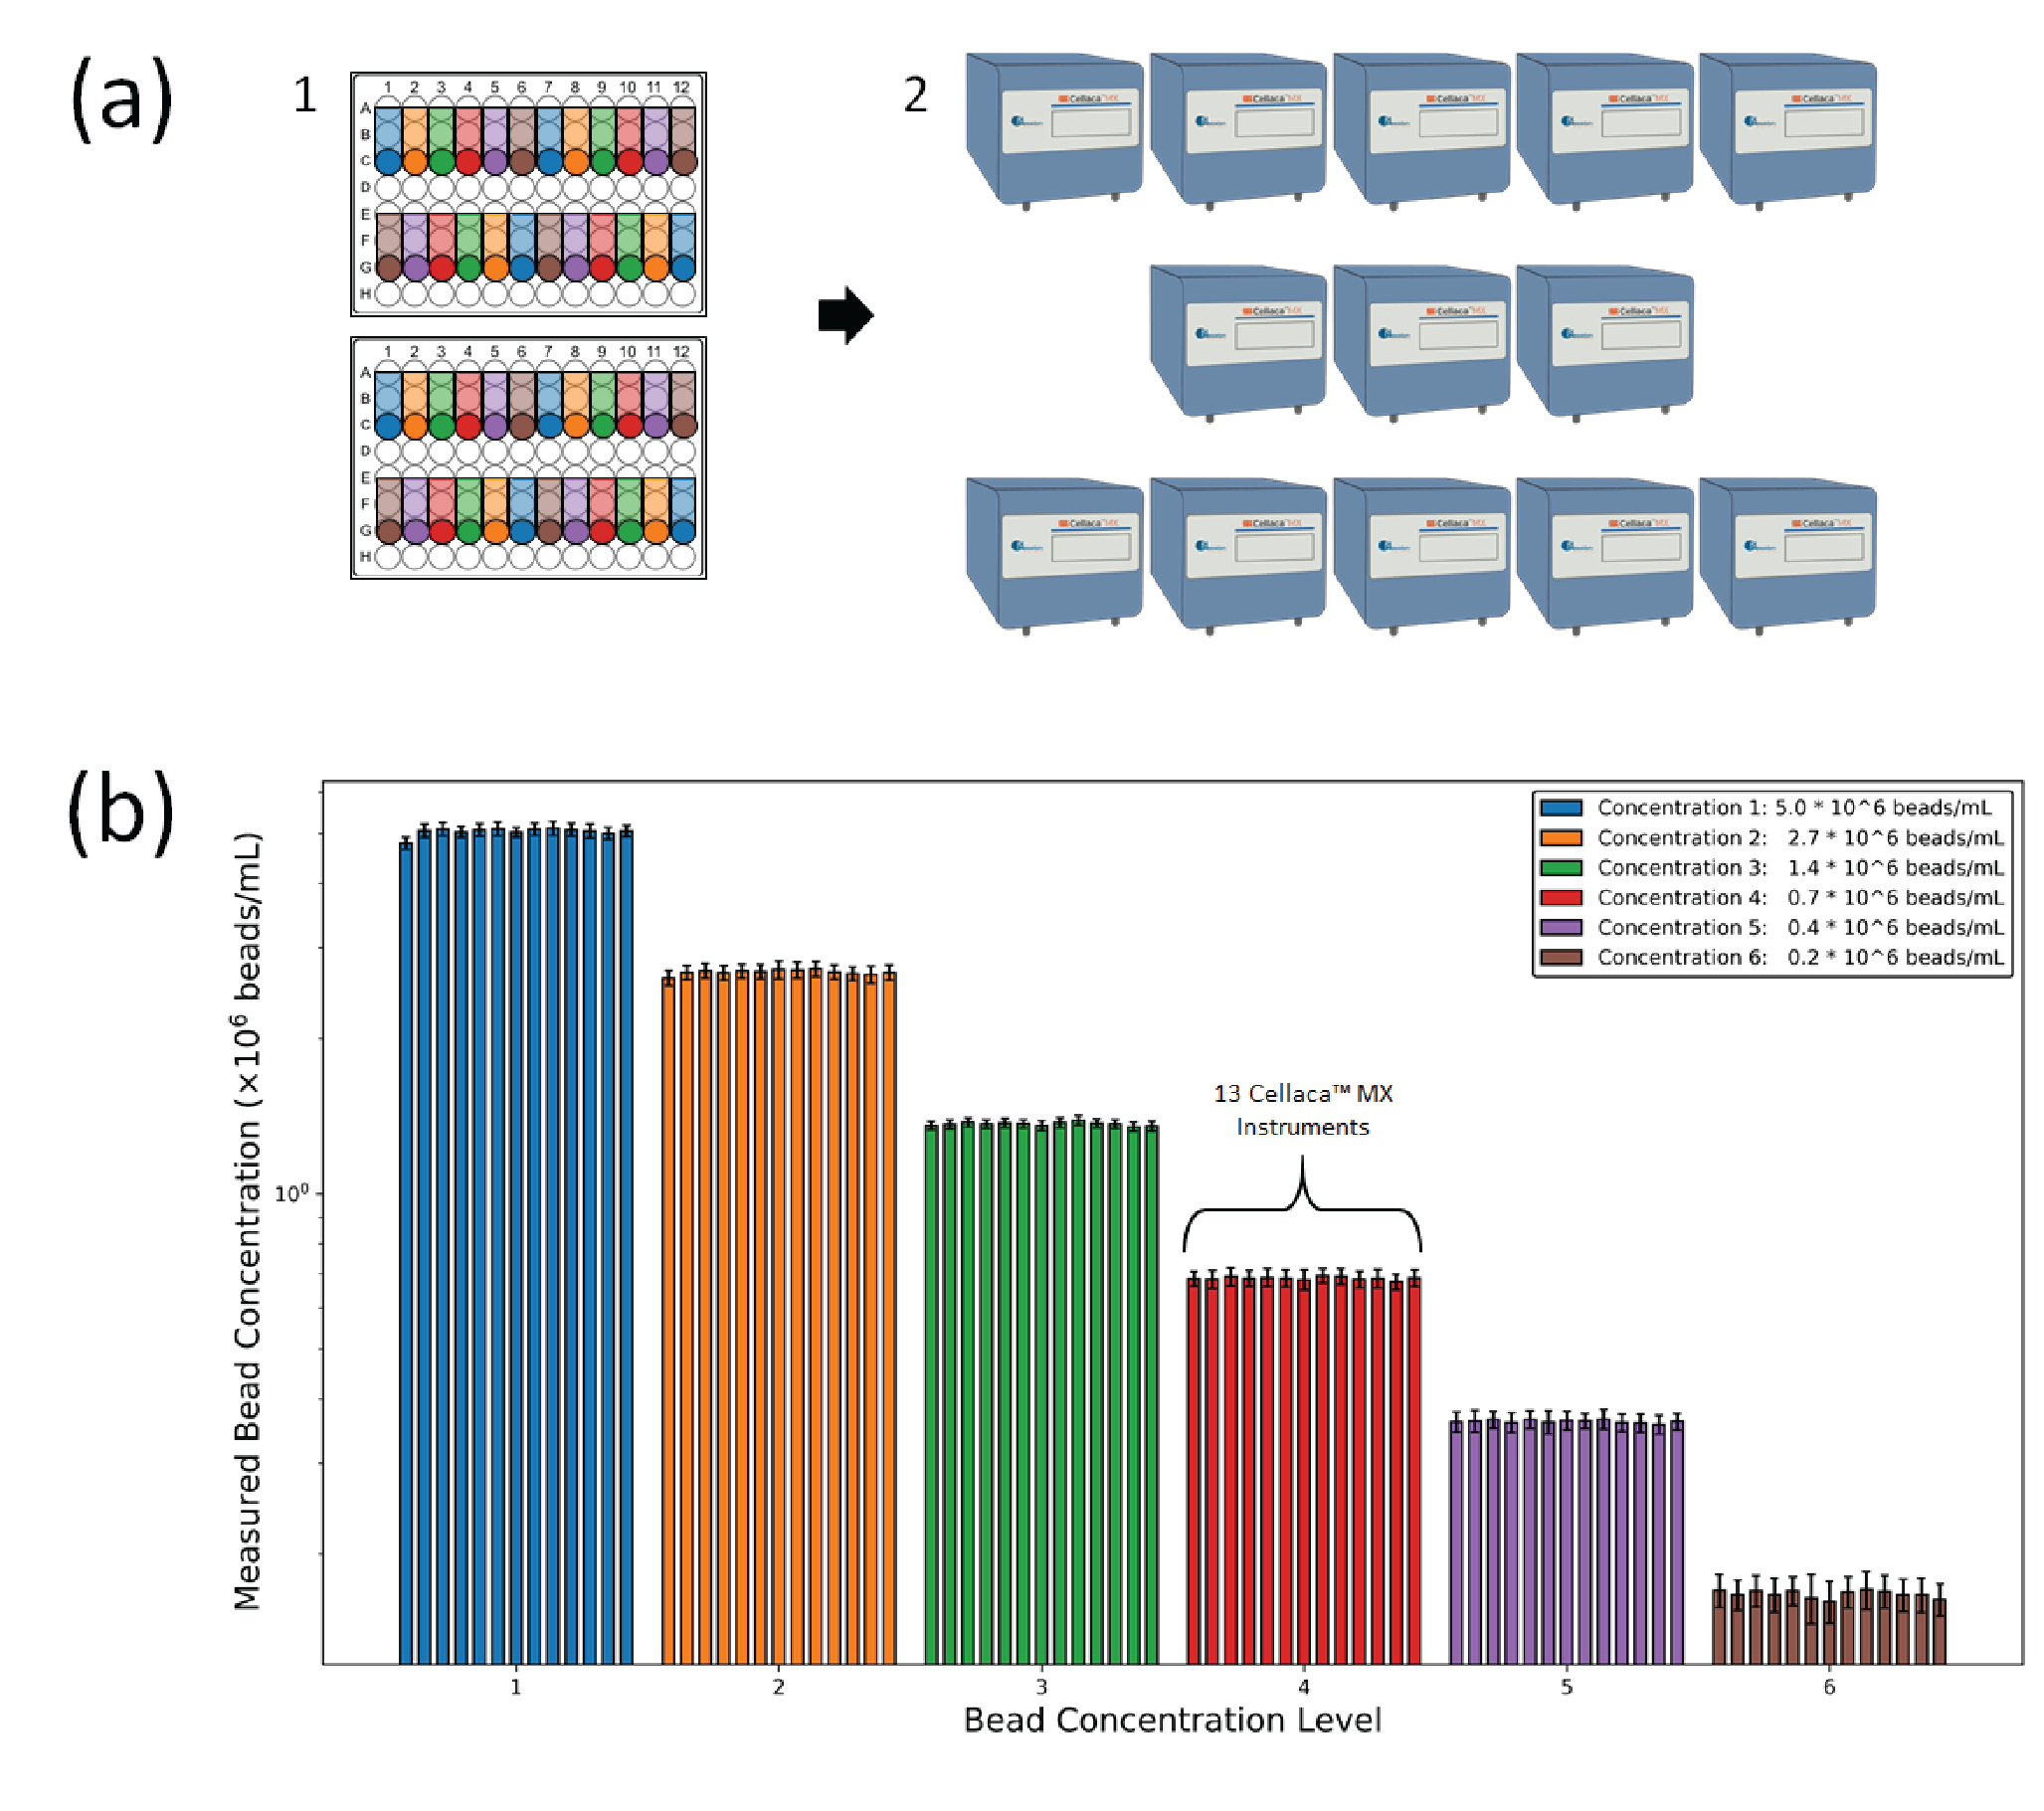
| Table 3 Bead counting consistency and precision characterization results for FL applications. | ||||||
| Precision level | Measured precision (CV) by concentration (beads/mL) | |||||
| 5.0 x 10⁶ | 2.7 x 10⁶ | 1.4 x 10⁶ | 0.7 x 10⁶ | 0.4 x 10⁶ | 0.2 x 10⁶ | |
| Analysis-to-analysis | 0.0% | 0.0% | 0.0% | 0.0% | 0.0% | 0.0% |
| Scan-to-scan | 0.28% | 0.36% | 0.42% | 0.47% | 0.75% | 0.8% |
| *Count-to-count | 3.1% | 3.6% | 2.3% | 4.3% | 4.9% | 8.3% |
| Plate-to-plate | 0.8% | 1.8% | 0.3% | 0.1% | 0.3% | 4.2% |
| Instrument-to-instrument | 1.7% | 1.0% | 0.8% | 0.7% | 0.7% | 1.7% |
| *System-wide precision | 3.2% | 3.5% | 2.2% | 3.8% | 4.3% | 7.8% |
| *The count-to-count and system-wide variation include random error and sample preparation error. | ||||||
To further characterize the FL mode on the Cellaca™ MX, the concentration and viability of a sample of Jurkat cells stained with AO/PI were measured on the same five Cellaca™ MX instruments used for the CHO TB experiment. The live cell concentration and viability results are plotted in Figure 4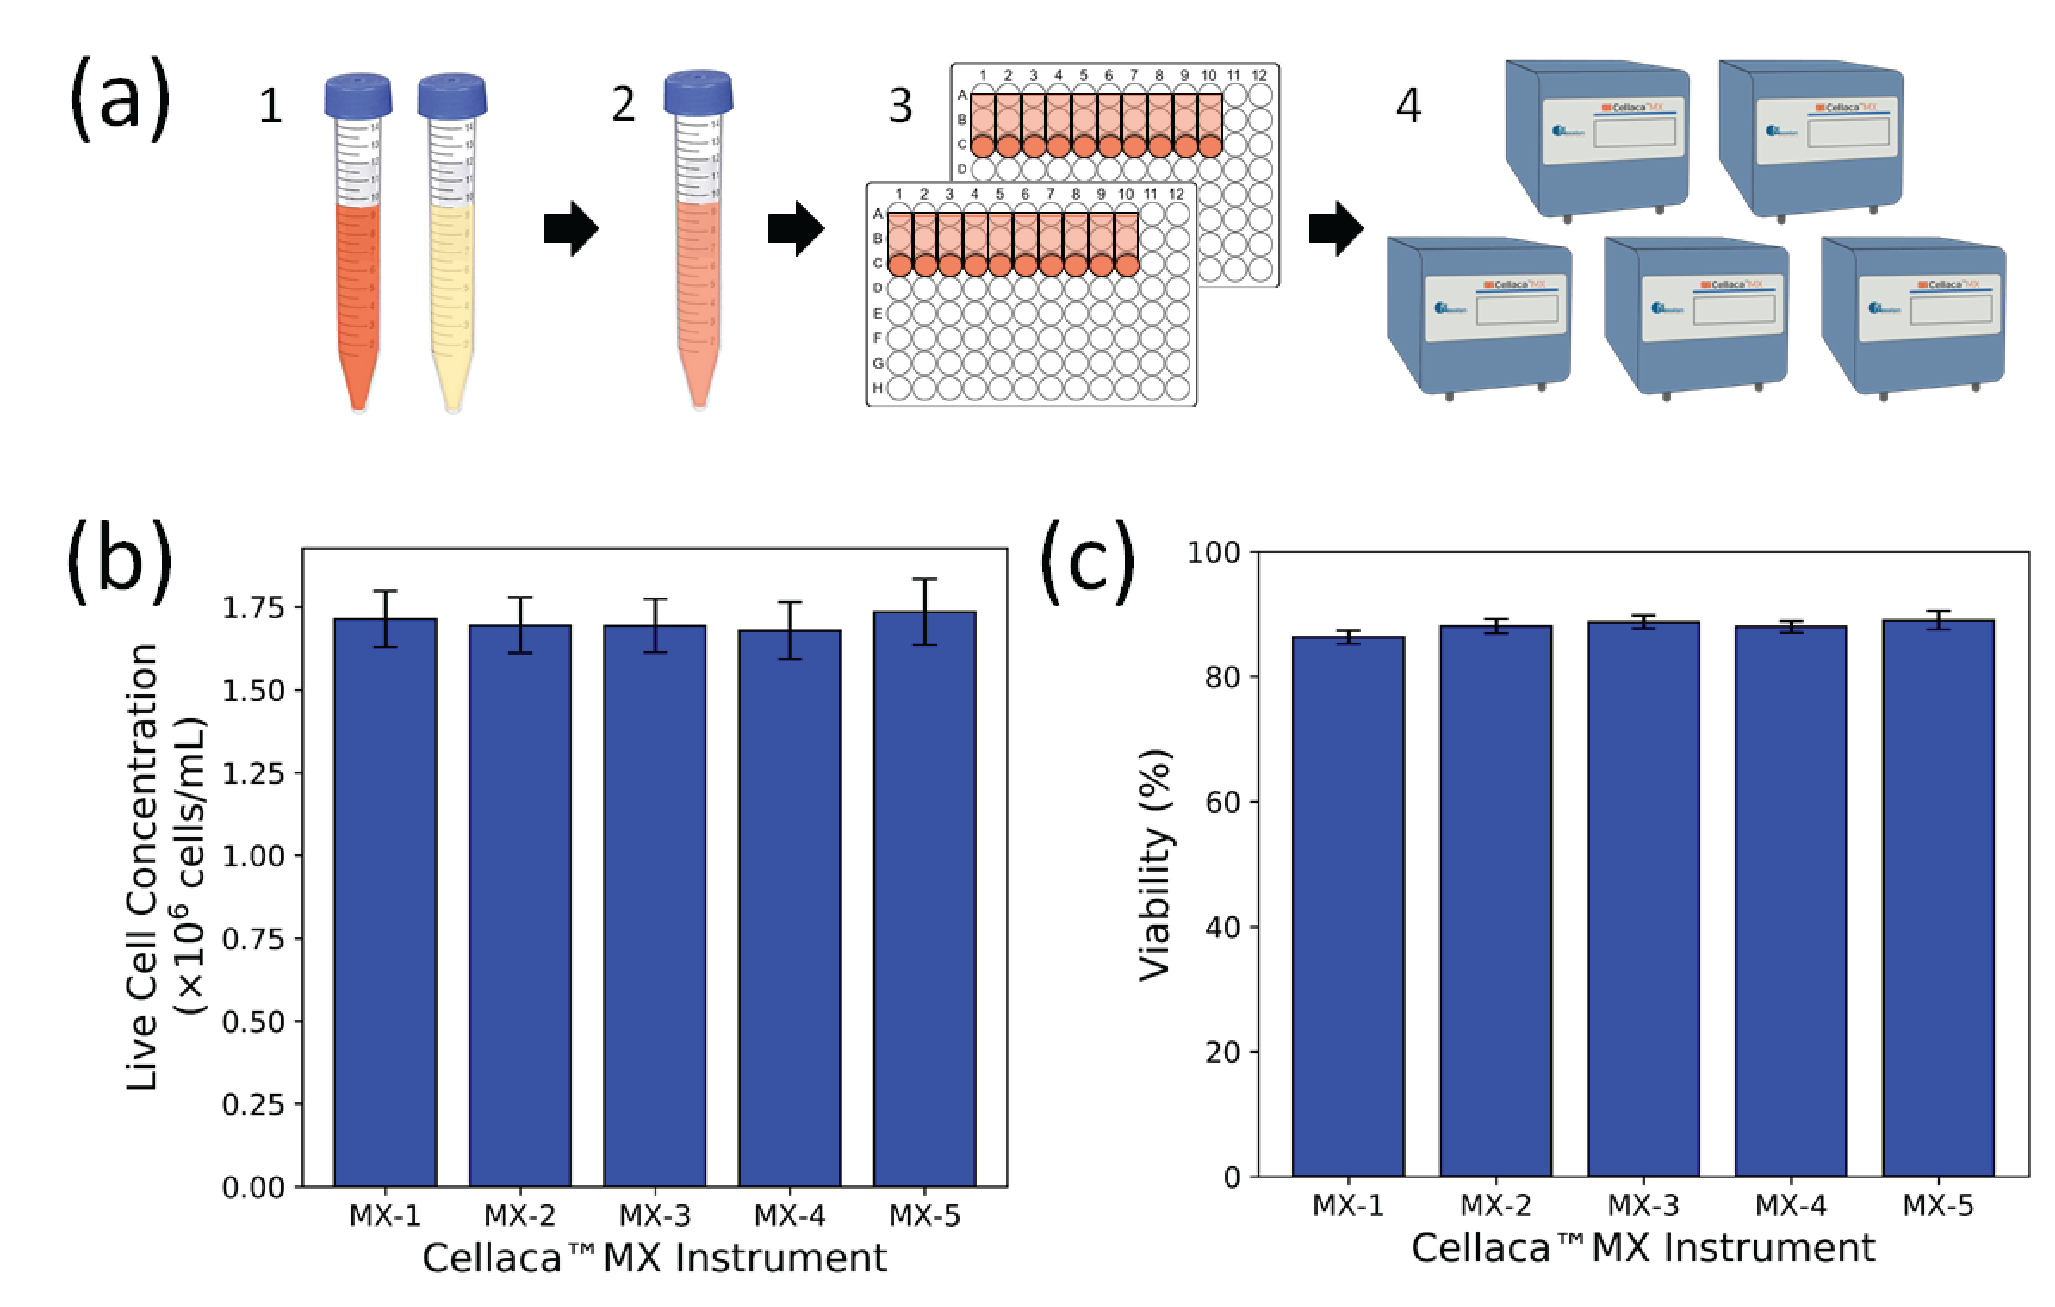
| Table 4 Jurkat cell counting and viability precision characterization results in FL. | |||
| Precision level | Jurkat total conc. (CV) | Jurkat live conc. (CV) | Jurkat viability (CV) |
| *Count-to-count | 5.8% | 5.9% | 3.8% |
| Plate-to-plate | 1.7% | 1.7% | 0.9% |
| Instrument-to-instrument | 3.4% | 2.2% | 1.8% |
| *System-wide | 7.0% | 6.6% | 4.4% |
| *The count-to-count and system-wide variation include random error and sample preparation error. | |||
The AO/PI assay has demonstrated higher cell counting quality for primary cell samples (containing RBC residues, platelets, and debris) compared to the TB assay [8]Chan LL, Wilkinson AR, Paradis BD, Lai N. Rapid Image-based Cytometry for Comparison of Fluorescent Viability Staining Methods. J. Fluorescence 2012; 22(5): 1301–11.Chan LL, Wilkinson AR, Paradis BD, Lai N. Rapid Image-based Cytometry for Comparison of Fluorescent Viability Staining Methods. J. Fluorescence 2012; 22(5): 1301–11., [13]Mascotti K, McCullough J, Burger SR. HPC viability measurement: trypan blue versus acridine orange and propidium iodide. Transfusion 2000; 40: 693–6.Mascotti K, McCullough J, Burger SR. HPC viability measurement: trypan blue versus acridine orange and propidium iodide. Transfusion 2000; 40: 693–6., [14]Chan LLY, Laverty DJ, Smith T, Nejad P, Hei H, Gandhi R, Kuksin D, Qiu J. Accurate measurement of peripheral blood mononuclear cell concentration using image cytometry to eliminate RBC-induced counting error. J. Immunol. Methods 2013; 388(1–2): 25–32.Chan LLY, Laverty DJ, Smith T, Nejad P, Hei H, Gandhi R, Kuksin D, Qiu J. Accurate measurement of peripheral blood mononuclear cell concentration using image cytometry to eliminate RBC-induced counting error. J. Immunol. Methods 2013; 388(1–2): 25–32., [29]Chan LL-Y, Smith T, Kumph KA et al. A high-throughput AO/PI-based cell concentration and viability detection method using the Celigo image cytometry. Cytotechnology 2016; 68(5): 2015–25. Chan LL-Y, Smith T, Kumph KA et al. A high-throughput AO/PI-based cell concentration and viability detection method using the Celigo image cytometry. Cytotechnology 2016; 68(5): 2015–25. . Critcally, Mascotti et al. (2000) showed that incubating cells with TB for an extended period of time can be detrimental to the cells and lower viability, while AO/PI assay did not. Since Cellaca™ MX can rapidly measure cell concentration and viability for 24 samples in less than 4 and 8 min, respectively, both the TB and AO/PI assays and AO/PI assay will not be affected by the counting time.
Cell counting quality characterization using ISO Cell Counting Standard Part 2
Accuracy is one of the critical parameters described in the ICH Q2 (R1) guidance document [39]Validation of Analytical Procedures: Text and Methodology Q2(R1). In: Guideline IHT; 2005.Validation of Analytical Procedures: Text and Methodology Q2(R1). In: Guideline IHT; 2005., [40]Guidance for Industry: Process Validation: General Principles and Practices. In: Services USDoHaH, Administration FaD, (CDER) CfDEaR, (CBER) CfBEaR, (CVM) CfVM; 2011., [41]Guidance for Industry: Analytical Procedures and Methods Validation for Drugs and Biologics. In: Services USDoHaH, Administration FaD, (CDER) CfDEaR, (CBER) CfBEaR; 2015.. While precision describes how well a measurement method agrees with itself, accuracy quantifies how well it agrees with a known reference standard. Accuracy is difficult to define for cell counting due to the lack of stable live cell reference standards. Cells in a sample are constantly changing and are always sub-sampled from a larger volume, and both of these factors introduce uncertainties during counting. Other biological questions also challenge the meaning of cell counting accuracy such as:
- What is a live cell?;
- What cells are dividing, dying, or dead?; and
- How would someone define cell life and death considering attributes such as compromised membranes, enzymatic activity, and initiation of apoptosis?
Instead of determining the accuracy of a cell counting method, the guidance from ISO 20391-2 can be employed to compare the proportionality of multiple cell counting methods using a dilution series design. While the ‘actual’ live cell concentration of a sample may not be known, a reasonable assumption is that doubling the sample volume by appropriate dilution should reduce the live cell concentration by half. The quality of a cell counting method can thus be linked to its ability to produce a number that is inversely proportional to the dilution of the sample. It is therefore helpful to follow guidance documents to evaluate the quality of the cell counting method for the intended purposes of the downstream assays. For a valid comparison between methods using such an evaluation, the two methods should be assessed, the two methods should be assessed simultaneously using the same cell samples.
The ISO Cell Counting Standards method characterization includes three main quality indicators: R2, CV, and PI, as implemented by the National Institute of Standards and Technology [20]Sarkar S, Lund SP, Vyzasatya R et al. Evaluating the quality of a cell counting measurement process via a dilution series experimental design. Cytotherapy 2017; 19(12): 1509–21.Sarkar S, Lund SP, Vyzasatya R et al. Evaluating the quality of a cell counting measurement process via a dilution series experimental design. Cytotherapy 2017; 19(12): 1509–21.Sarkar S, Lund SP, Vyzasatya R et al. Evaluating the quality of a cell counting measurement process via a dilution series experimental design. Cytotherapy 2017; 19(12): 1509–21.Sarkar S, Lund SP, Vyzasatya R et al. Evaluating the quality of a cell counting measurement process via a dilution series experimental design. Cytotherapy 2017; 19(12): 1509–21.. Although various metrics can be used as a proportionality index, we calculated the PI using the smoothed scaled absolute value of residuals [20]Sarkar S, Lund SP, Vyzasatya R et al. Evaluating the quality of a cell counting measurement process via a dilution series experimental design. Cytotherapy 2017; 19(12): 1509–21.Sarkar S, Lund SP, Vyzasatya R et al. Evaluating the quality of a cell counting measurement process via a dilution series experimental design. Cytotherapy 2017; 19(12): 1509–21.Sarkar S, Lund SP, Vyzasatya R et al. Evaluating the quality of a cell counting measurement process via a dilution series experimental design. Cytotherapy 2017; 19(12): 1509–21.Sarkar S, Lund SP, Vyzasatya R et al. Evaluating the quality of a cell counting measurement process via a dilution series experimental design. Cytotherapy 2017; 19(12): 1509–21.. It should be noted that this metric is not normalized to the number of DFs or biological replicates in the experimental design, and its value should not be compared across experiments.
Characterizing proportionality is important in assessing the quality of a cell counting method. On the other hand, it is equally important to characterize how the two results of two methods agree with each other. For this purpose, we performed Bland-Altman comparative analyses to visualize differences between two methods across a range of measurement values. Bland-Altman plots (mean-difference plots) show differences between results from two methods with respect to their average values. Because variance in cell counting is proportional to cell sample concentration, we utilized the percent difference rather than absolute difference to obtain roughly the same variance across the concentration range. Bland-Altman analysis returns a value for the bias between two methods with its accompanying CI, as well as the LoAs, showing the range of differences that can be expected for a single measurement.
In this experiment, ISO Cell Counting Standard Part 2 guidance was followed to characterize and compare cell counting quality between the Cellaca™ MX and Celigo® for CHO and Jurkat cells stained with AO. Both instruments were used to measure samples from the same Cellaca™ plates for direct comparison. The results are presented in Figure 5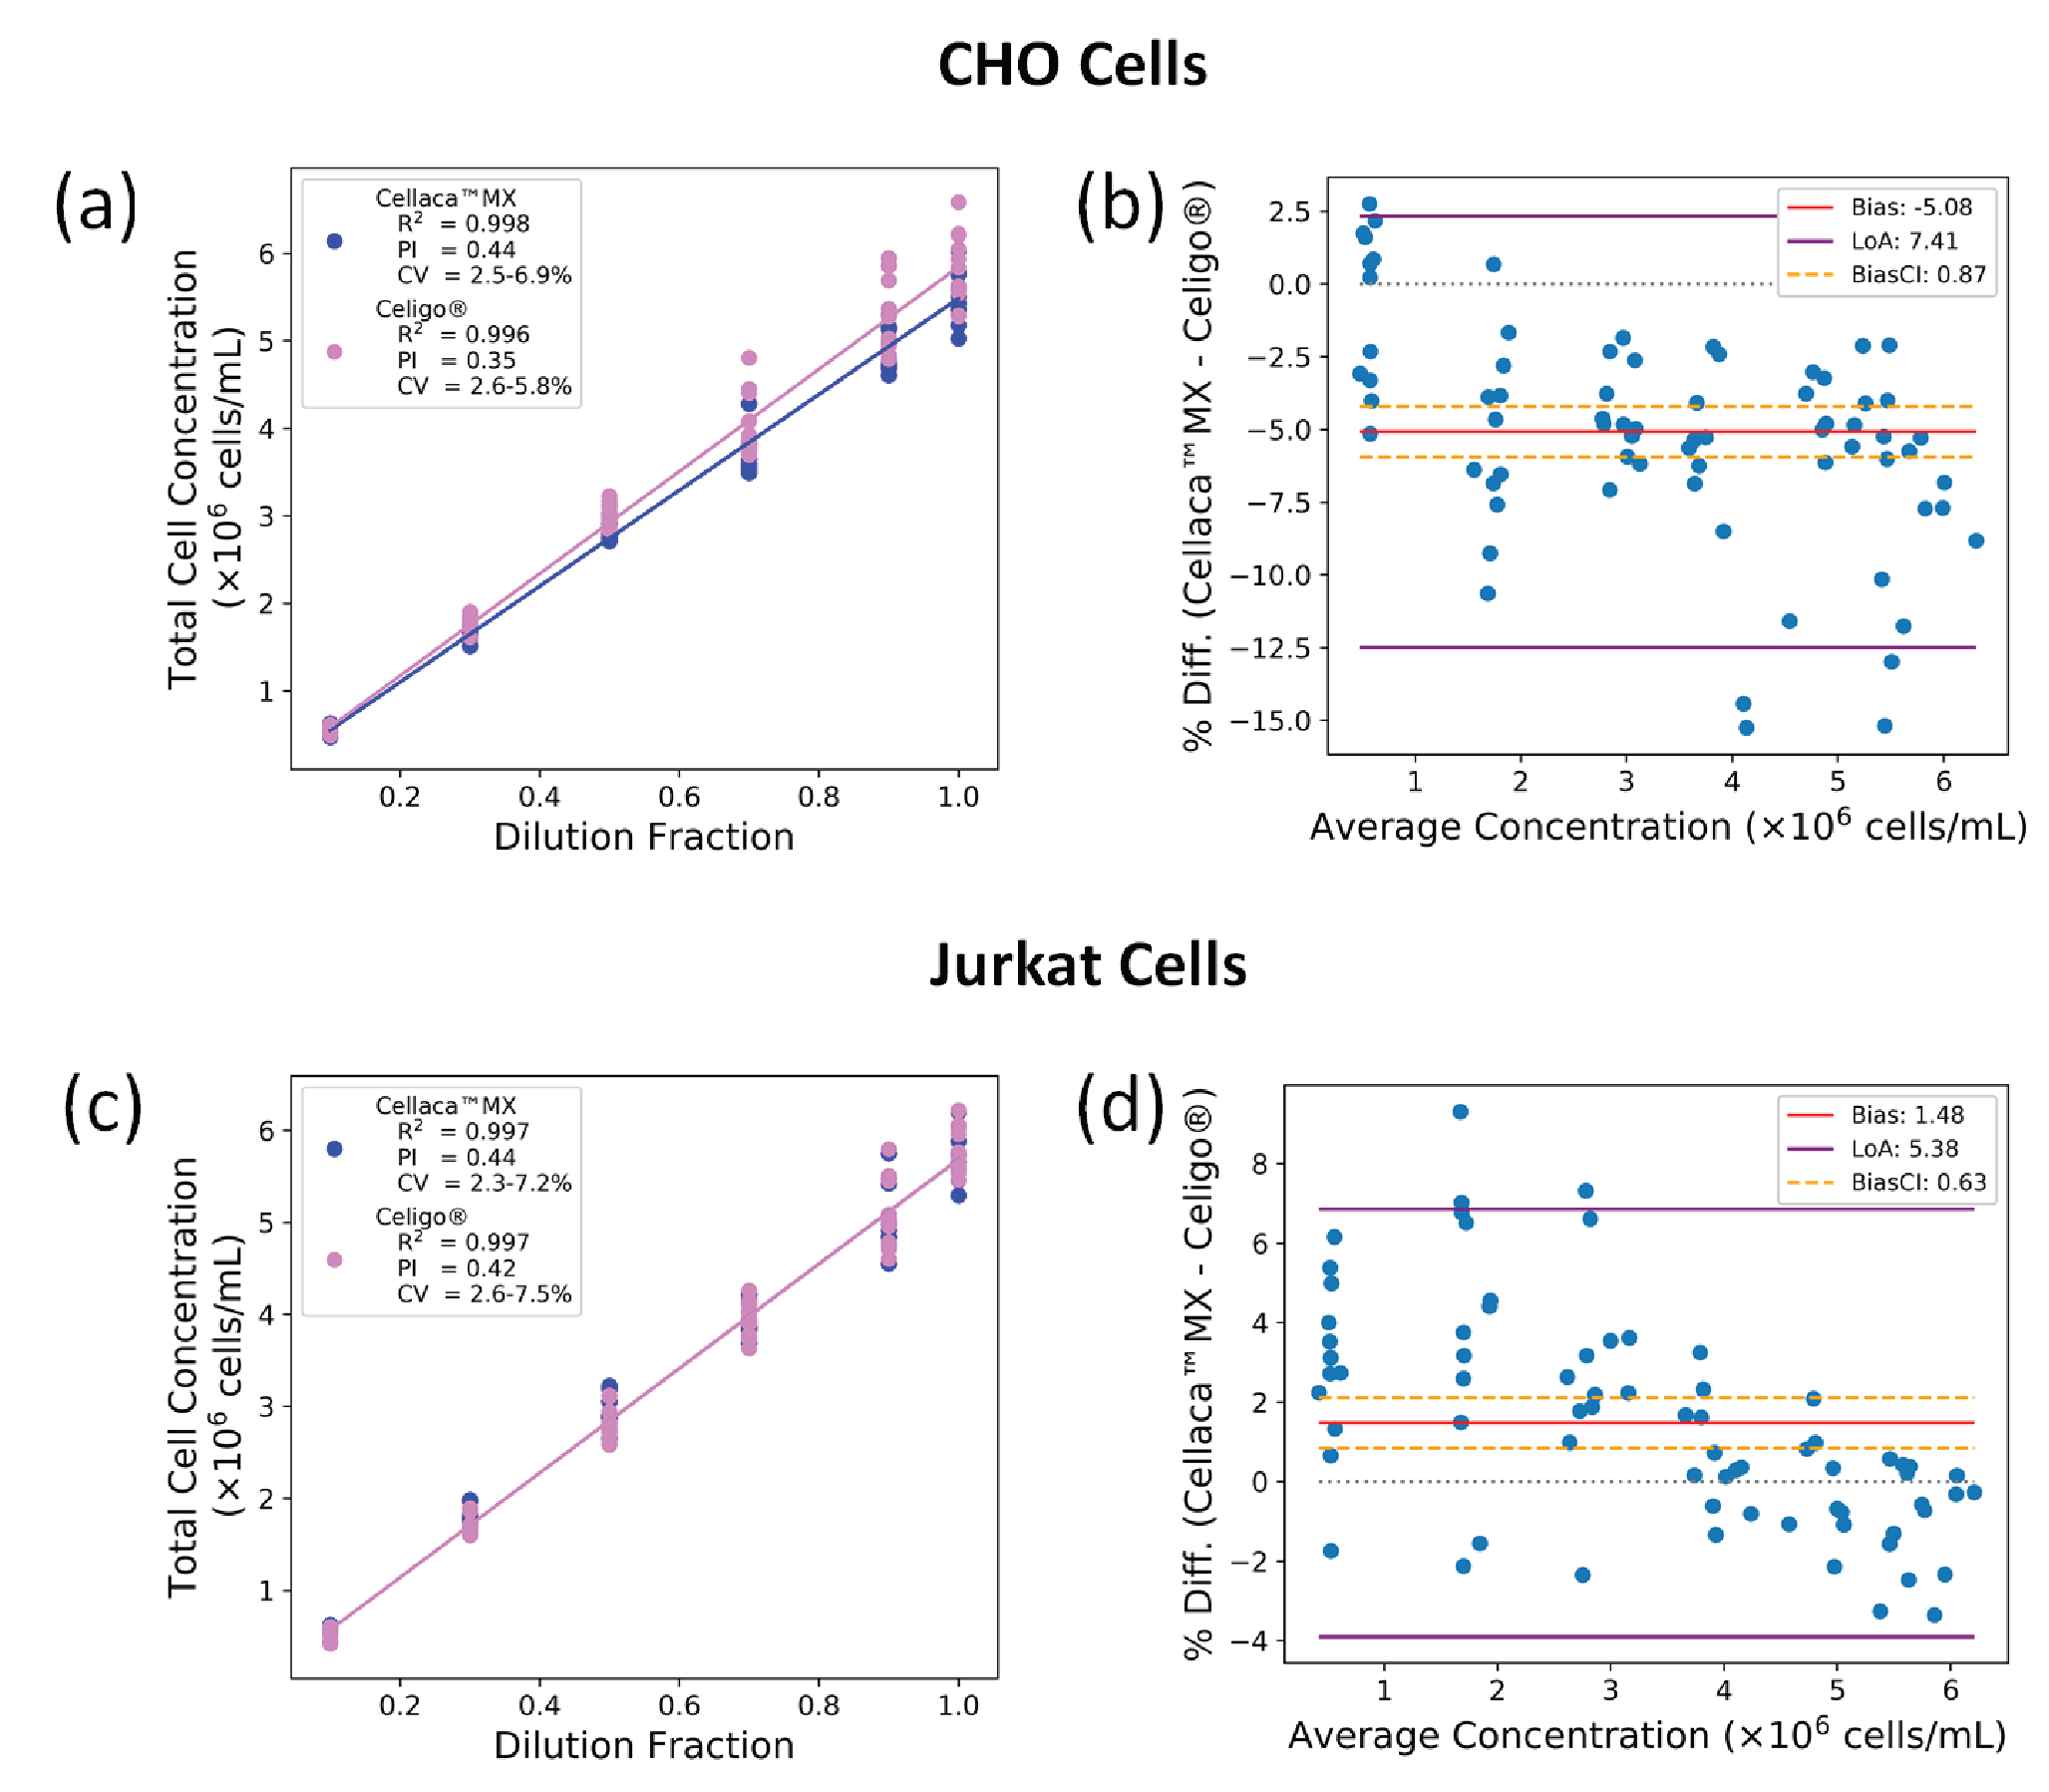
The CHO cell concentration measurement ranged from 5 x 10⁵ to 6 x 10⁶ cells/mL. The Cellaca™ MX results showed values of 2.7–7.0% for CV, 0.998 for R2, and 0.44 for PI. The results from Celigo® were 2.7–6.4% for CV, 0.996 for R2, and 0.35 for PI. The Bland-Altman comparison gave a bias of -5.1% ± 0.9% (95% CI) between the two methods (Celigo® counting higher), and the LoAs spanned -12.5% to 2.3%.
For Jurkat cells, the Cellaca™ MX results showed values of 2.2–7.5% for CV, 0.997 for R2, and 0.44 for PI. The Celigo® produced 1.8–7.6% for CV, 0.997 for R2, and 0.42 for PI. Bland-Altman analysis returned a bias of 1.5% ± 0.6% between the two methods (Cellaca™ MX counting higher), with a LoA range of -3.9% to 6.9%.
For cell counting methods evaluated using the same experimental design, a lower PI is considered more optimal or proportional. The Celigo® generated slightly more proportional results than the Cellaca™ MX, even though the two PI values are not statistically different. The R2 and CV values were comparable for both instruments across the experiments. There was a small but statistically significant bias between the two methods, indicated by the value of zero falling outside the 95% CI. Interestingly, the Cellaca™ MX tended to count slightly higher than the Celigo® for lower concentrations.
Direct comparison to other cell counting methods
Characterizing the proportionality of a cell counting method is a rigorous way of addressing the lack of live-cell reference standards, but comparison to an independent method is often used in practice. Here we compare counts obtained with the Cellaca™ MX to those from the manual hemocytometer method, the Cellometer® Auto2000, and the Cellometer® Vision.
Bright field beads and CHO cells were used to compare Cellaca™ MX and hemocytometer. Three independent samples of 5 μm-beads were analyzed, each with 40 counts for the manual counting method and 144 counts (6 plates) for the Cellaca™ MX method. The values for the Cellaca™ MX were ∼1.2% lower, ∼2.35% lower, and ~0.71% higher than the manual counts for the three samples. The CVs for the Cellaca™ MX were 3.7%, 3.6%, and 3.9%, whereas the hemocytometer CVs were 4.5%, 4.3%, and 4.3% (Figure 6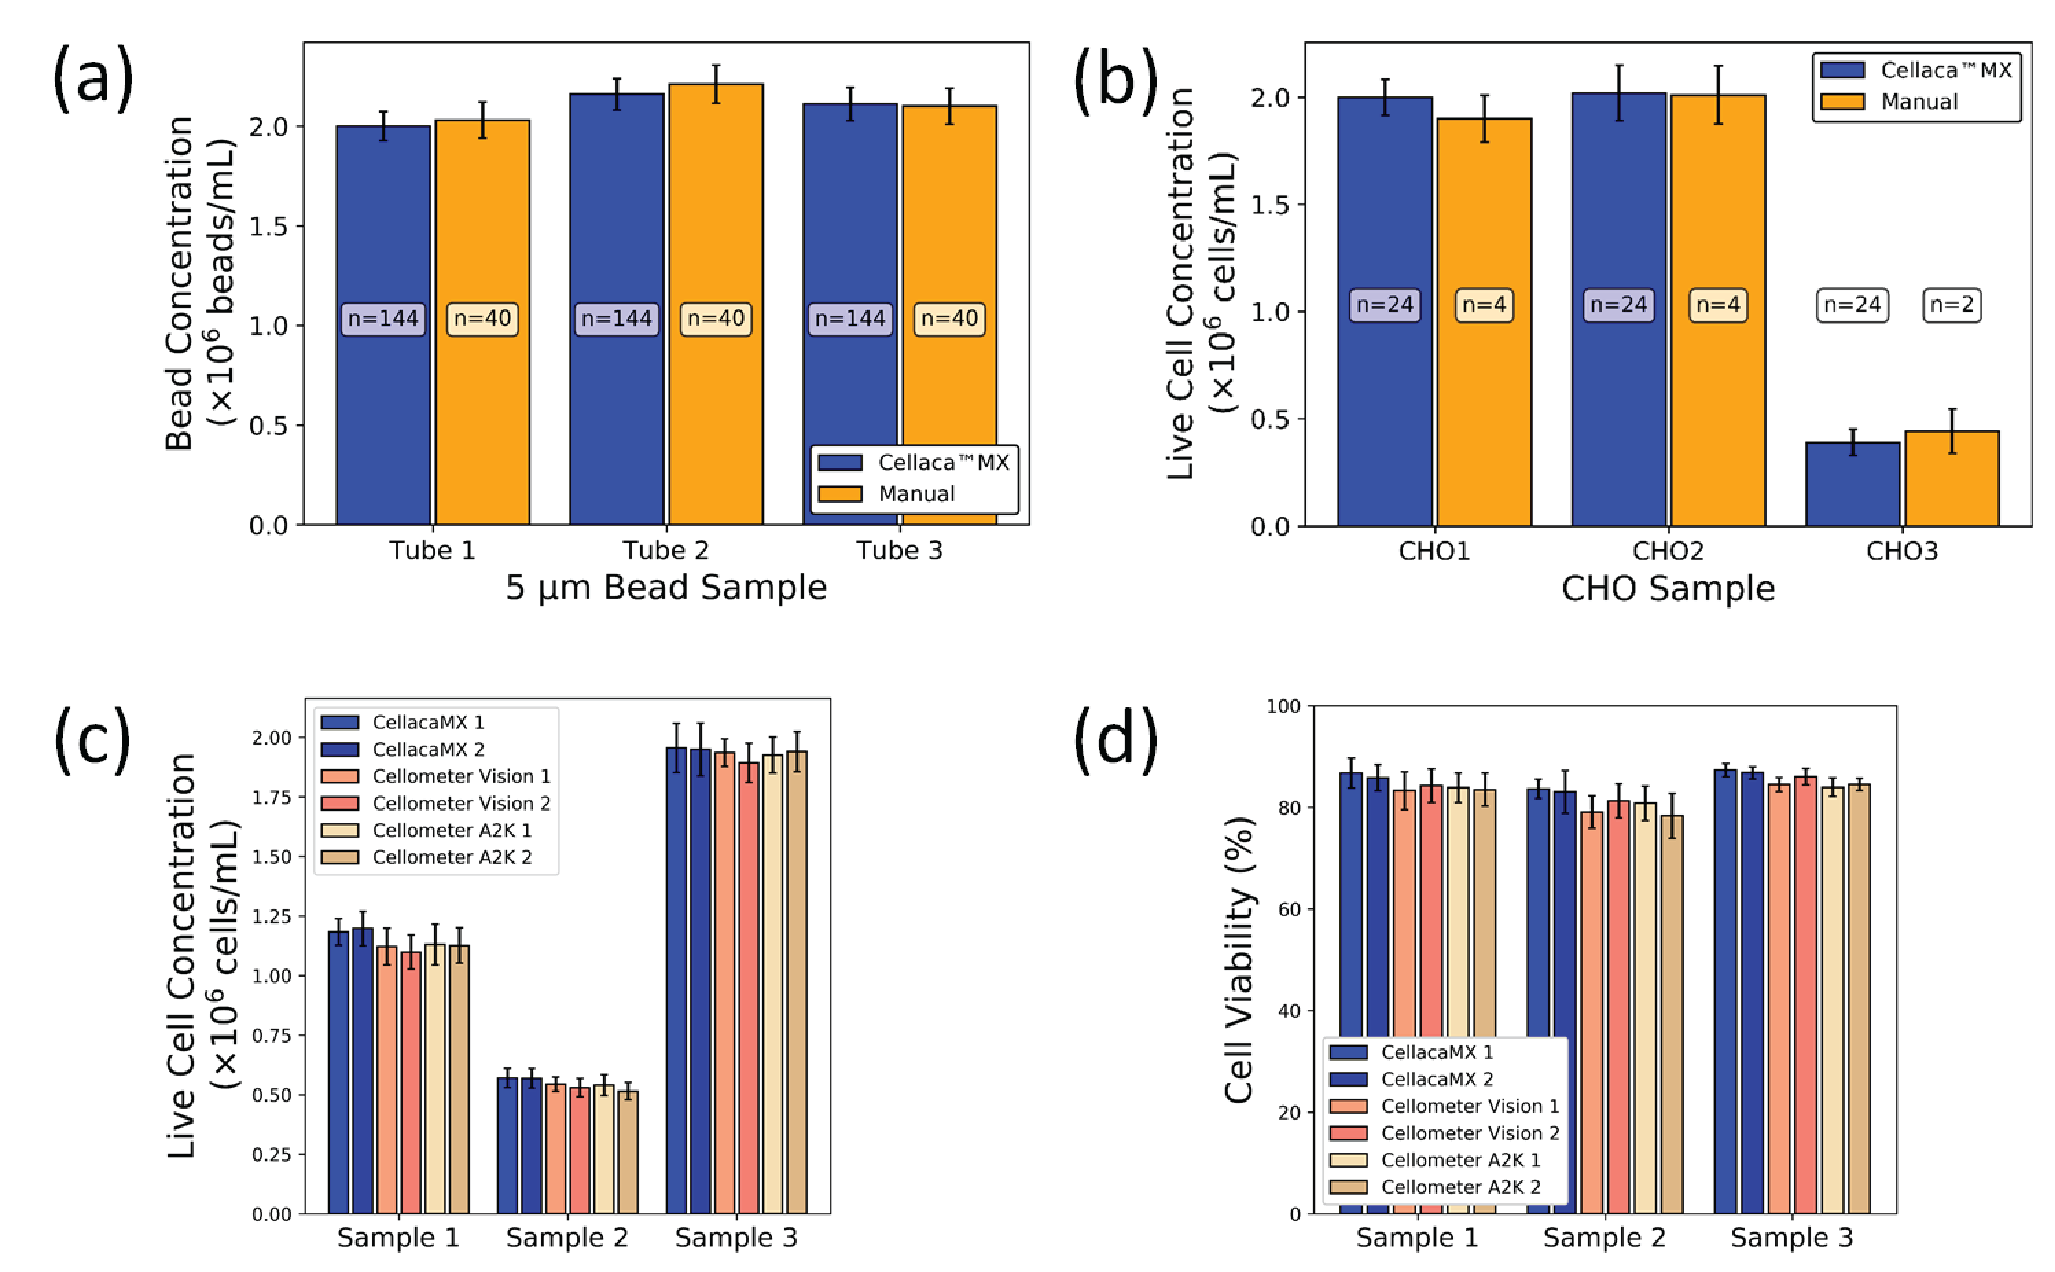
The CHO cell samples were measured on both Cellaca™ MX (n = 24) and hemocytometer (n = 4), which generated comparable cell counting results. The values for the Cellaca™ MX were ~5.3% higher, ~0.5% higher, and ∼12.1% lower than the manual counts for the 2 high and 1 low concentration samples. The concentration CVs for Cellaca™ MX were 4.2%, 6.4%, and 15.7%, whereas the hemocytometer CVs were 5.8%, 6.8%, and 23.2% (Figure 6B).
Concentration and viability measurements were compared for two Cellaca™ MX, Cellometer® Vision, and Cellometer® Auto2000 instruments using AO/PI-stained Jurkat cells in three concentrations. All six instruments produced reasonably consistent results with CVs ranging from 1.4 to 8.0% for cell concentration and viability (Figure 6C & D). The live cell concentrations and viability results showed comparable results and CVs for each sample and instrument (Supplementary Table 2).
LoD & LoQ characterization using T cell dilution series
A standard serial dilution experiment can quickly characterize the linear range of a cell counting method with multiple DFs. The dilution series may reach sufficiently low concentrations to determine the method’s limit of detection (LoD) and limit of quantification (LoQ). Because the results are specific to a particular method, each cell type, assay, or instrument should be investigated separately.
We performed serial dilution of T cells stained with AO/PI and counted them on the Cellaca™ MX. The 15-point dilution series in Figure 7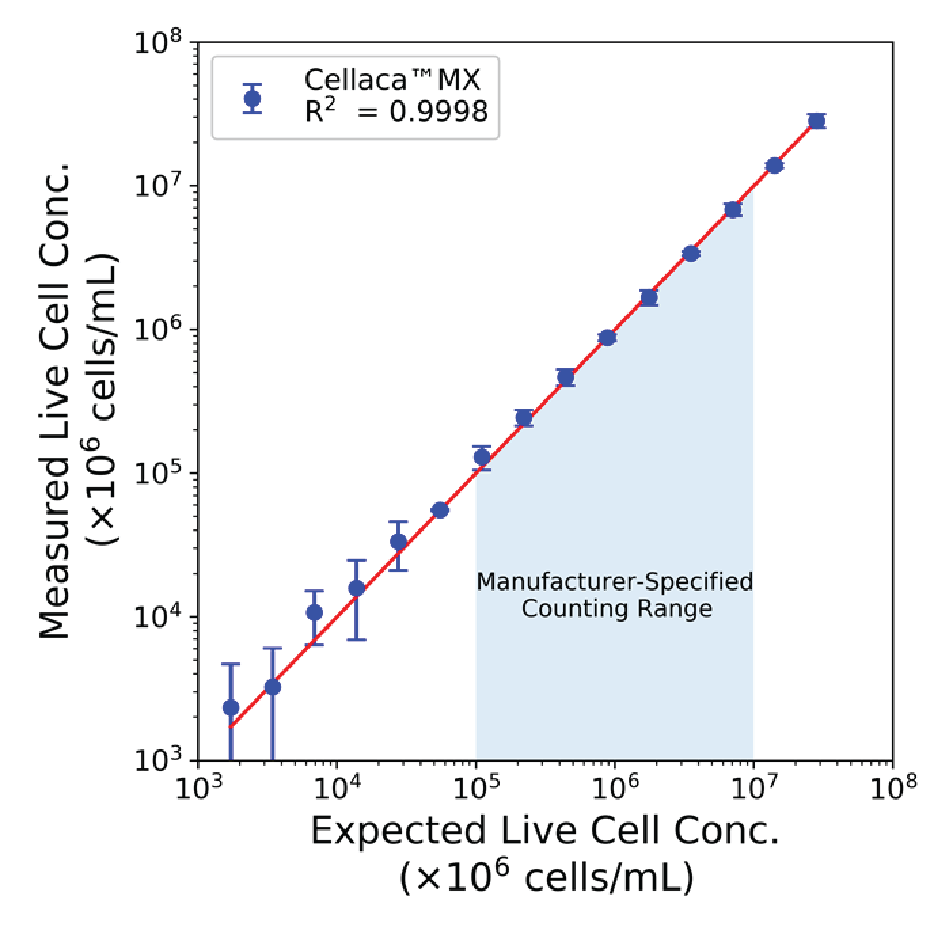
Conclusion
Reducing the cell counting bottleneck is critical to streamlining preclinical and clinical research and cell and biologics bioprocessing. This work demonstrated the characterization and application of the Cellaca™ MX high-throughput cell counter. The system can directly count cells in BF and FL in as little as 1 and 3 min, respectively. Cell counting performance was characterized for BF and FL applications using beads and CHO-S and Jurkat cells. We investigated and quantified precision within the Cellaca™ MX platform, including count-to-count, plate-to-plate, and instrument-to-instrument precision showing overall variation <8% for BF and FL. The results demonstrated high-quality cell counting evaluated through a dilution series experiment and assessing the R2, CV, and PI following the guidance of ISO Cell Counting Standard Part 2. The Cellaca™ MX was comparable to the traditional hemocytometer and single-sample-based automatic cell counters. Finally, we explored the instrument’s sensitivity to high- and low-concentration T cell samples and visualized result linearity over 4 logs of cell concentration. We recommend that similar characterization experiments following the guidance of ISO Cell Counting Standards should be performed to thoroughly evaluate other cell counting methods. The Cellaca™ MX high-throughput cell counter is a novel system that can rapidly provide reliable data with the high precision needed for cell and immunotherapy applications.
References
1. Seimetz D, Heller K, Richter J. Approval of First CAR-Ts: Have we Solved all Hurdles for ATMPs? Cell Medicine 2019; 11: 1–16. Crossref
2. Vaddepally RK, Kharel P, Pandey R, Garje R, Chandra AB. Review of Indications of FDA-Approved Immune Checkpoint Inhibitors per NCCN Guidelines with the Level of Evidence. Cancers 2020; 12(3): 738. Crossref
3. Bartheld CSv, Bahney J, Herculano-Houzel S. The search for true numbers of neurons and glial cells in the human brain: A review of 150 years of cell counting. J. Comp. Neurol. 2016; 524(18): 3865–95. Crossref
4. Briggs C. Quality counts: new parameters in blood cell counting. Int. J. Lab. Hematol. 2009; 31(3): 277–97. Crossref
5. Väyrynen JP, Vornanen JO, Sajanti S, Böhm JP, Tuomisto A, Mäkinen MJ. An improved image analysis method for cell counting lends credibility to the prognostic significance of T cells in colorectal cancer. Virchows Archive 2012; 460: 455–65. Crossref
6. Chan LLY, Lai N, Wang E, Smith T, Yang X, Lin B. A rapid detection method for apoptosis and necrosis measurement using the Cellometer imaging cytometry. Apoptosis 2011; 16(12): 1295–303. Crossref
7. Berkes CA, Chan LLY, Wilkinson A, Paradis B. Rapid quantification of pathogenic fungi by Cellometer image-based cytometry. J. Microbiol. Methods 2012: 468–76. Crossref
8. Chan LL, Wilkinson AR, Paradis BD, Lai N. Rapid Image-based Cytometry for Comparison of Fluorescent Viability Staining Methods. J. Fluorescence 2012; 22(5): 1301–11. Crossref
9. Cadena-Herrera D, Lara JEE-D, Ramírez-Ibañez ND et al. Validation of three viable-cell counting methods: Manual, semi-automated, and automated. Biotechnol. Rep. 2009; 7: 9–16. Crossref
10. Huang L-C, Lin W, Yagami M et al. Validation of cell density and viability assays using Cedex automated cell counter. Biologicals 2010; 38(3): 393–400. Crossref
11. Louis KS, Siegel AC. Cell Viability Analysis Using Trypan Blue: Manual and Automated Methods. In: Stoddart M (Ed.). Mammalian Cell Viability. Methods in Molecular Biology (Methods and Protocols). Volume 740: Humana Press; 2011. Crossref
12. Chen A, Leith M, Tu R, Tahim G, Sudra A, Bhargava S. Effects of diluents on cell culture viability measured by automated cell counter. PLOS One 2017; 12(3) :e0173375. Crossref
13. Mascotti K, McCullough J, Burger SR. HPC viability measurement: trypan blue versus acridine orange and propidium iodide. Transfusion 2000; 40: 693–6. Crossref
14. Chan LLY, Laverty DJ, Smith T, Nejad P, Hei H, Gandhi R, Kuksin D, Qiu J. Accurate measurement of peripheral blood mononuclear cell concentration using image cytometry to eliminate RBC-induced counting error. J. Immunol. Methods 2013; 388(1–2): 25–32. Crossref
15. Chan LL-Y, Kuksin D, Laverty DJ, Saldi S, Qiu J. Morphological observation and analysis using automated image cytometry for the comparison of trypan blue and fluorescence-based viability detection method. Cytotech. 2015; 67(3): 461–73. Crossref
16. Chan LL-Y, Rice WL, Qiu J. Observation and quantification of the morphological effect of trypan blue rupturing dead or dying cells. PLoS One 2020; 15(1): e0227950. Crossref
17. Hanamsagar R, Reizis T, Chamberlain M et al. An optimized workfow for single cell transcriptomics and repertoire profling of purifed lymphocytes from clinical samples. Sci. Rep. 2020; 10(2219). Crossref
18. Zhu L, Yang P, Zhao Y et al. Single-Cell Sequencing of Peripheral Mononuclear Cells Reveals Distinct Immune Response Landscapes of COVID-19 and Influenza Patients. Immunity 2020; 53: 685–96. Crossref
19. Biotechnology – Cell counting – Part 2: Experimental design and statistical analysis to quantify counting method performance. International Organization for Standardization 2019. Crossref
20. Sarkar S, Lund SP, Vyzasatya R et al. Evaluating the quality of a cell counting measurement process via a dilution series experimental design. Cytotherapy 2017; 19(12): 1509–21. Crossref
21. Sarkar S, Pierce L, Lin-Gibson S, Lund SP. Standards Landscape in Cell Counting: Implications for Cell & Gene Therapy. Cell Gene Ther. Ins. 2019; 5(1): 117–31. Crossref
22. Xu Y, Chan LL-Y, Chen S et al. Optimization of UC-MSCs cold-chain storage by minimizing temperature fluctuations using an automatic cryopreservation system. Cryobiology 2021; 99: 131–9. Crossref
23. Bieberich F, Vazquez-Lombardi R, Yermanos A et al. A single-cell atlas of lymphocyte adaptive immune repertoires and transcriptomes reveals age-related differences in convalescent COVID-19 patients. bioRxiv 2021. Crossref
24. Sun T, Zhang K, Pangeni RP et al. Histone Methyltransferase G9a Promotes Invasion of Non-small Cell Lung Cancer Through Enhancing Focaladhesionkinase Activationvia NF-KB Signaling Pathway. Research Square 2021. Crossref
25. Zeijlemaker W, Kelder A, Cloos J, Schuurhuis GJ. Immunophenotypic Detection of Measurable Residual (Stem Cell) Disease Using LAIP Approach in Acute Myeloid Leukemia. Curr. Protoc. Cytom. 2019; 91(e66). Crossref
26. Chan LL, Zhong XM, Qiu J, Li PY, Lin B. Cellometer Vision as an Alternative to Flow Cytometry for Cell Cycle Analysis, Mitochondrial Potential, and Immunophenotyping. Cytometry Part A 2011; 79A(7): 507–17. Crossref
27. Chan LLY, Shen D, Wilkinson AR et al. A novel image-based cytometry method for autophagy detection in living cells. Autophagy 2012; 8(9): 1371–82. Crossref
28. Chan LL-Y, Huang J, Hagiwara Y, Aguila L, Rowe D. Discriminating Multiplexed GFP Reporters in Primary Articular Chondrocyte Cultures Using Image Cytometry. J. Fluoresc. 2014; 24(4): 1041–53. Crossref
29. Chan LL-Y, Smith T, Kumph KA et al. A high-throughput AO/PI-based cell concentration and viability detection method using the Celigo image cytometry. Cytotechnology 2016; 68(5): 2015–25. Crossref
30. Zigon ES, Purseglove SM, Toxavidis V, Rice W, Tigges J, Chan LL-Y. A rapid single cell sorting verification method using plate-based image cytometry. Cytometry Part A 2018; 93(10): 1060–5. Crossref
31. Magnotti EL, Chan LL-Y, Zhu Q, Marasco WA. A high-throughput chemotaxis detection method for CCR4+ T cell migration inhibition using image cytometry. J. Immunol. Methods 2020; 112747. Crossref
32. Maldini CR, Love AC, Tosh KW et al. Characterization of CAR T cell expansion and cytotoxic potential during Ex Vivo manufacturing using image-based cytometry. J. Immunol. Meth. 2020; 484–485: 112830. Crossref
33. Wang Y, Chan LL-Y, Grimaud M, Fayed A, Zhu Q, Marasco WA. High-Throughput Image Cytometry Detection Method for CAR-T Transduction, Cell Proliferation, and Cytotoxicity Assays. Cytometry Part A 2020: Crossref
34. Altman DG, Bland JM. Measurement in Medicine: The Analysis of Method Comparison Studies. The Statistician 1983; 32(3): 307–17. Crossref
35. Bland JM, Altman DG. Statistical Methods For Assessing Agreement Between Two Methods of Clinical Measurement. The Lancet 1986; 327(8476): 307–10. Crossref
36. Carkeet A. A Review of the Use of Confidence Intervals for Bland-Altman Limits of Agreement in Optometry and Vision Science. Optom. Vis. Sci. 2020; 97(1): 3–8. Crossref
37. Tholudur A, Giron L, Alam K et al. Comparing Automated and Manual Cell Counts for Cell Culture Applications. BioProcess Int. 2006. Crossref
38. Biotechnology — Cell counting — Part 1: General guidance on cell counting methods. International Organization for Standardization 2018. Crossref
39. Validation of Analytical Procedures: Text and Methodology Q2(R1). In: Guideline IHT; 2005. Crossref
40. Guidance for Industry: Process Validation: General Principles and Practices. In: Services USDoHaH, Administration FaD, (CDER) CfDEaR, (CBER) CfBEaR, (CVM) CfVM; 2011. Crossref
41. Guidance for Industry: Analytical Procedures and Methods Validation for Drugs and Biologics. In: Services USDoHaH, Administration FaD, (CDER) CfDEaR, (CBER) CfBEaR; 2015. Crossref
Affiliations
Jordan Bell
Department of Advanced Technology R&D, Nexcelom Bioscience LLC, Lawrence, MA 01843, USA
Yongyang Huang
Department of Advanced Technology R&D, Nexcelom Bioscience LLC, Lawrence, MA 01843, USA
Henry Qazi
Department of Advanced Technology R&D, Nexcelom Bioscience LLC, Lawrence, MA 01843, USA
Dmitry Kuksin
Department of Advanced Technology R&D, Nexcelom Bioscience LLC, Lawrence, MA 01843, USA
Jean Qiu
Department of Advanced Technology R&D, Nexcelom Bioscience LLC, Lawrence, MA 01843, USA
Bo Lin
Department of Advanced Technology R&D, Nexcelom Bioscience LLC, Lawrence, MA 01843, USA
Leo Li-Ying Chan
Author for correspondence
Department of Advanced Technology R&D, Nexcelom Bioscience LLC, Lawrence, MA 01843, USA
lchan@nexcelom.com
![]()
Authorship & Conflict of Interest
Contributions: Jordan Bell, Yongyang Huang and Leo Li-Ying Chan: Conceptualization; data curation; formal analysis; investigation; methodology; visualization; writing original draft; writing-review and editing. Leo Li-Ying Chan and Jean Qiu: Project administration; resources; supervision; conceptualization. Henry Qazi and Dmitry Kuksin: Data curation; formal analysis; writing original draft; writing-review and editing. Bo Lin: Conceptualization.
Acknowledgements: The authors would like to thank Samantha Saksene for providing the hemocytometer manual counting results of non-fluorescent beads.
Disclosure and potential conflicts of interest: The authors are currently employees of Nexcelom Bioscience and declare competing financial interests. The characterization experiments and comparisons conducted in this manuscript are a demonstration of the Cellaca™ MX high-throughput cell counter and improvements in efficiency, consistency, and versatility from currently available cell counting methods.
Funding declaration: The authors received no financial support for the research, authorship and/or publication of this article.
Article & copyright information
Copyright: Published by Cell and Gene Therapy Insights under Creative Commons License Deed CC BY NC ND 4.0 which allows anyone to copy, distribute, and transmit the article provided it is properly attributed in the manner specified below. No commercial use without permission.
Attribution: Copyright © 2021 Nexcelom Bioscience. Published by Cell and Gene Therapy Insights under Creative Commons License Deed CC BY NC ND 4.0.
Article source: Invited; externally peer reviewed.
Submitted for peer review: Mar 5 2021; Revised manuscript received: Apr 16 2021; Publication date: May 14 2021.