Optimizing the clarification of industrial scale viral vector culture for gene therapy
Cell & Gene Therapy Insights 2019; 5(9), 1311–1322.
10.18609/cgti.2019.137
Viral-based vector systems such as lentivirus (LV) and adeno-associated virus (AAV) are widely used and show great potential for delivery of genetic material to target cells in gene therapy. Downstream processing of LV and AAV offers its own unique challenges to generate clinical products of high titer, high potency, and high purity. For AAV, downstream challenges include the undesired production of empty capsids, and the process typically requires a cell lysis step, which generates a significant amount of host cell contaminants. In the case of LV, downstream challenges include low virus stability due to the presence of a fragile lipid envelope layer, as well as sensitivity to pH variations, salt concentrations, and shear stress. The objective of this work was to identify an efficient clarification strategy to remove a wide range of impurities found in typical adherent and suspension based viral vector cell culture. These include host cells, cell debris, aggregates, and cell culture media components. The clarification step needs to combine high throughput for impurity removal, high product yield, and ease of scale-up to prepare for downstream operations. Our testing evaluated various depth filters, prefilters, and bioburden reduction membrane filters, made up of different organic and inorganic materials, to clarify the viral vector cell culture. Both AAV and LV processes can be adherent or suspension based, each having their own challenges. In this work, we compared clarification options in terms of throughput and recovery for adherent LV and suspension AAV viral vector feed streams.
Introduction
Gene therapies are some of today’s most promising patient treatments, where gene-modifying technologies are used to repair, correct, or add new functions to the body’s own cells. After years of research, the industry is seeing a rapidly increasing pipeline of gene therapy products and a few commercially available products in the USA. The pipeline is very strong, with over 1000 products in clinical trials, and with approximately 90 in Phase 3 [1]. The products must all undergo process development, where the challenge is to manufacture functional product economically, with sufficient quantity and quality. LV and AAV are the most commonly used viruses for therapeutic purposes due to their specific functional properties.
One of the methods in gene therapy uses expression systems capable of making viral vectors in quantities suitable for therapeutic use. The most commonly used systems are based on transient transfection in either adherent or suspension cell culture.
Yield is an important parameter when evaluating a viral vector gene therapy process. Each process step potentially reduces the amount of active viral vectors. The first process step after cell culture is the removal of cells, cell debris, and other impurities to reduce biological burden as much as possible. The easiest and most economical technology to clarify the cell culture is filtration. The chosen filter or filter combination should demonstrate high throughput and high yield.
This study not only describes how different filter materials for cell culture clarification influence yield, but it also demonstrates a strategy to define an efficient and scalable method for clarification. The study investigates the feasibility of filters made from cellulose, polymers, or inorganic material such as glass fiber to clarify LV produced using HEK293T cells in adherent format, or AAV produced in HEK293 cells grown in suspension.
The results that are shown demonstrate the influence of filter materials and construction on throughput and yield during the clarification step, and will help illustrate a strategy to define the most efficient and scalable filtration steps.
![]()
Materials
Cell culture properties
To cover a broad range of processes, two types of cell culture were used.
Lentivirus
Lentivirus product was produced with HEK293T cells in an adherent cell culture bioreactor. The harvested post-transfection solution had a turbidity of up to 20 nephelometric turbidity units (NTU). Figure 1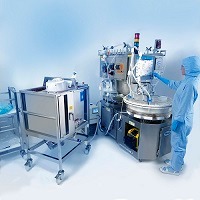
Adeno-associated virus
The adeno-associated virus product was produced using HEK293 cells in a suspension cell culture bioreactor. The suspension cell culture was harvested after the cells were lysed and had a turbidity around 430 – 540 NTU. Figure 2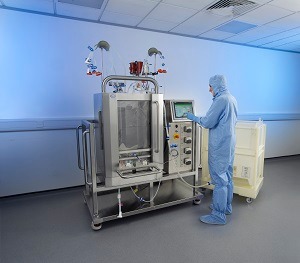
Filter choice
Depth filters, prefilters, and bioburden reduction membrane filters were tested with the described cell cultures.
Depth filters
The primary clarification step removes large debris and macromolecular complexes from the harvesting bioreactor. One of the most common technologies for primary clarification is depth filtration. Depth filters remove contaminants through means of direct impaction, entrapment, and adsorption. These modes of separation occur on the surface of the filter, as well as within the matrix of the depth media.
Depth filters are made with different combinations of cellulose, perlite, diatomaceous earth, and resin binders. These filters have high solids loading capacity due to the depth of the filter media, which allows for the removal of a broad size range of debris. Removing the debris allows for higher throughputs to be achieved on the next process step – bioburden reduction.
The Seitz depth filters were tested in a single layer format and in dual layer combinations. The compositions of the filters used in this study are shown in Table 1.
| Table 1: Filter types and retention ratings of the filters tested in these studies. | ||||
|---|---|---|---|---|
| Process | Filter | Media material of construction | Retention ratings | Filter type |
| LV | SuporLife® | PES | 0.45 µm | Bioburden reduction membrane filter |
| LV | Fluorodyne® II DBL | PVDF | 0.45 µm | Bioburden reduction membrane filter |
| LV | Ultipor® N66 | Nylon 66 | 0.45 µm | Bioburden reduction membrane filter |
| LV | PreFlow™ UB | Resin-bonded GF | 0.45 µm | Prefilter |
| LV | Supor® EAV | PES | 0.2 µm | Bioburden reduction membrane filter |
| AAV | Seitz Bio 10 | Cellulose, resin | 0.2–0.4 µm | Depth filter |
| AAV | Seitz V100P | Cellulose, perlite, resin | 2–4 µm | Depth filter |
| AAV | Seitz HP PDH11 (K700P plus V100P) | Cellulose, diatomaceous earth, perlite, resin | 2–15 µm | Depth filter |
| AAV | Seitz HP PDK11 (K900P plus V100P) | Cellulose, diatomaceous earth, perlite, resin | 2–20 µm | Depth filter |
| AAV | Seitz HP PDP8 (T1500P plus 700P) plus Bio 10 in series | Cellulose, diatomaceous earth, perlite, resin | 0.2–30 µm | Depth filter |
Depth filters are known for high particle retention capacity. The particles are retained and bound to the filter material. This feature is ideal for high turbidity solutions. Therefore, they were used for the filtration of the AAV suspension cell cultures.
Prefilters & bioburden reduction membrane filters
The filter media is made of polymers such as polyethersulfone (PES), nylon, polyvinylidene fluoride (PVDF), and inorganic material such as resin-bonded glass fiber (GF). The polymeric membrane filters and the glass fiber prefilters are generally thinner than the cellulose based depth filters and show a more limited, but nevertheless sufficient particle retention capacity. In this study, a variety of filters were used to test both LV and AAV cell cultures
Table 1 shows the different filters used for each, as well as their retention ratings and primary material of construction.
![]()
Filtration trial methodology & results
Lentivirus
In the first stage of evaluation, all filters listed in Table 1 for LV process, except the Supor EAV, were tested. The cell culture feed turbidity was 7 NTU and the filtration experiments were performed at a constant pressure of 0.5 barg. Throughput, turbidity reduction, and viral vector yield were measured for each filter. Figure 3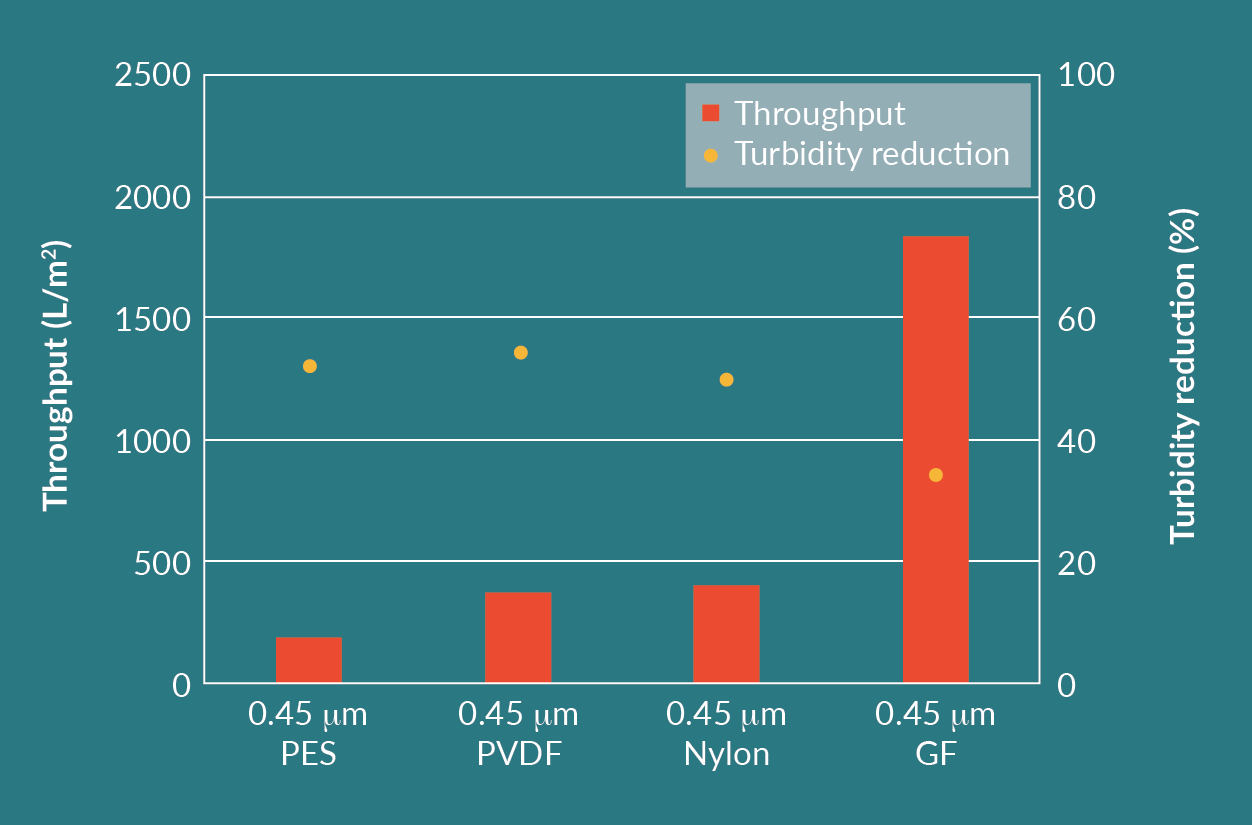
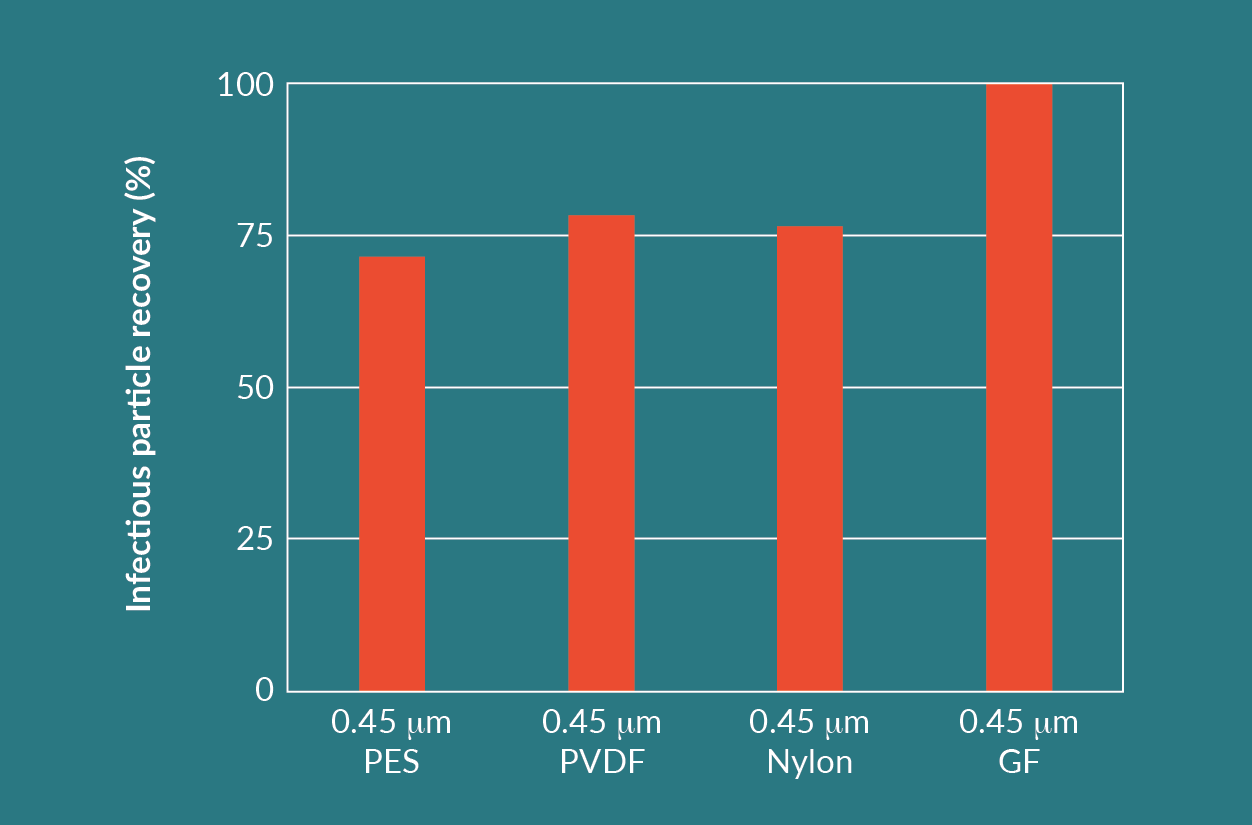
Comparing the results of the prefilters and membrane filters, the GF filter achieved a throughput that was 5–10 times higher than the other filters. The GF filter had an infectious particle yield close to 100%.
Since the GF filter is a nominally rated 0.45 µm prefilter, the inclusion of an additional bioburden reduction membrane filter as a second filtration step is required. A variety of membrane filters in series with the GF filter were tested. The testing was performed with the PVDF 0.45 µm, the nylon 0.45 µm, and the PES 0.45 µm membrane filters. Additionally, a nominally rated 0.2 µm PES was tested in parallel with the following filter trains (0.45 µm GF prefilter + 0.45 µm nylon membrane, 0.45 µm GF prefilter + 0.45 µm PES, and 0.45 µm GF prefilter + 0.45 µm PVDF membrane).
The cell culture for the second run had a feed turbidity of 4 NTU and the filtration experiments were performed at a constant pressure of 0.5 barg. Figure 5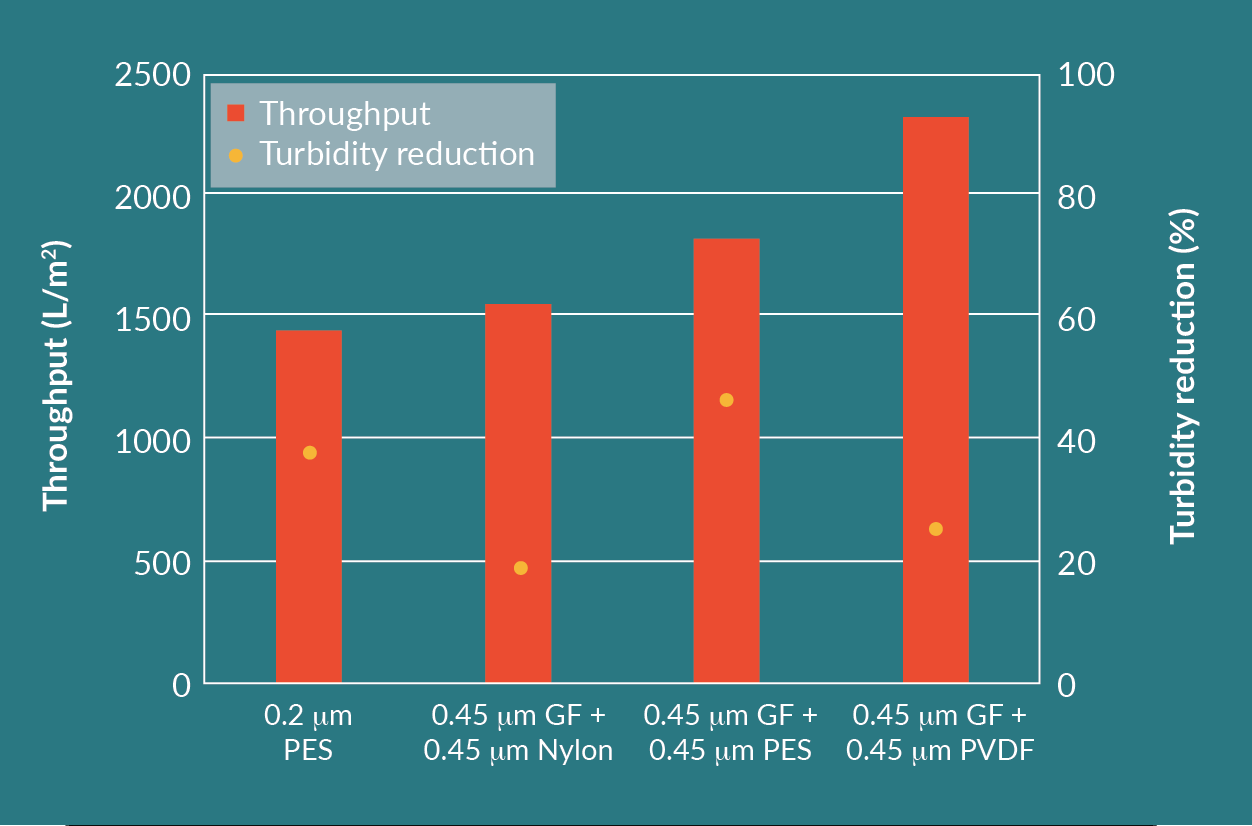
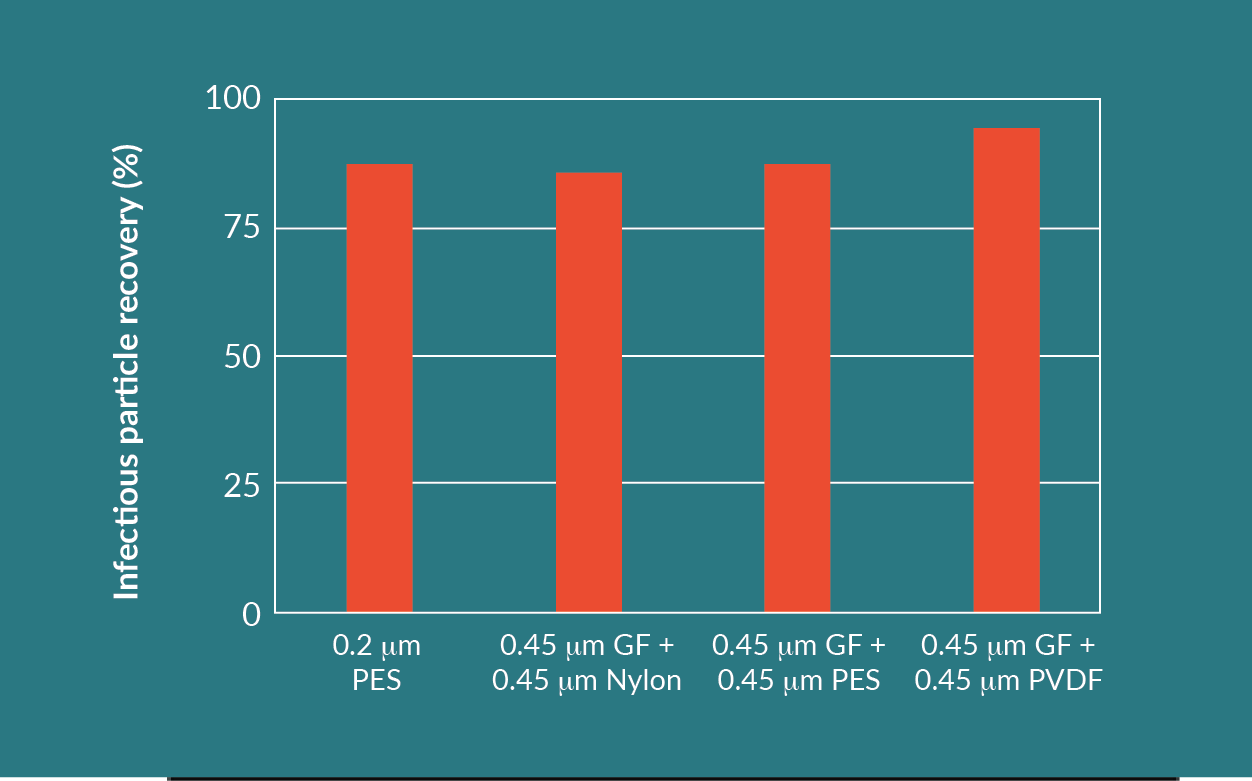
Comparing the results of the different filter combinations, the GF plus PVDF filter train achieved the highest throughput and highest infectious particle yield. This combination had an acceptable turbidity reduction.
Each filter combination, other than the 0.2 µm PES, utilizes two filters in series. Even though the throughput of the 0.2 µm PES was the lowest, this is a feasible option as well, considering only one filter is being used. The turbidity reduction and infectious particle yield for the 0.2 µm PES is similar to the other filter combinations.
Cost/efficiency analysis for LV filtration
The combination of the GF prefilter and the PVDF membrane filter showed the best results with respect to throughput and product yield. However, it is a two-step filtration process. From an economical and operational point of view, a one-step filtration process with the nominally rated 0.2 µm PES membrane filter can be considered as well. Comparing 254 mm (10 in.) capsules, the PES membrane filter with 1.06 m² effective filtration area (EFA) provides a significantly higher surface area than the GF prefilter with 0.68 m² EFA, and the PVDF membrane filter with 0.55 m² EFA.
To evaluate the influence of surface area per 254 mm (10 in.) filter capsule, another test was performed. The combination of the GF prefilter and the PVDF membrane filter was tested in parallel with the 0.2 µm PES membrane.
The cell culture feed had a turbidity of 14 NTU and the experiment was performed at a constant pressure of 1 barg. Throughputs and turbidity reduction were measured for each filter, shown in Figure 7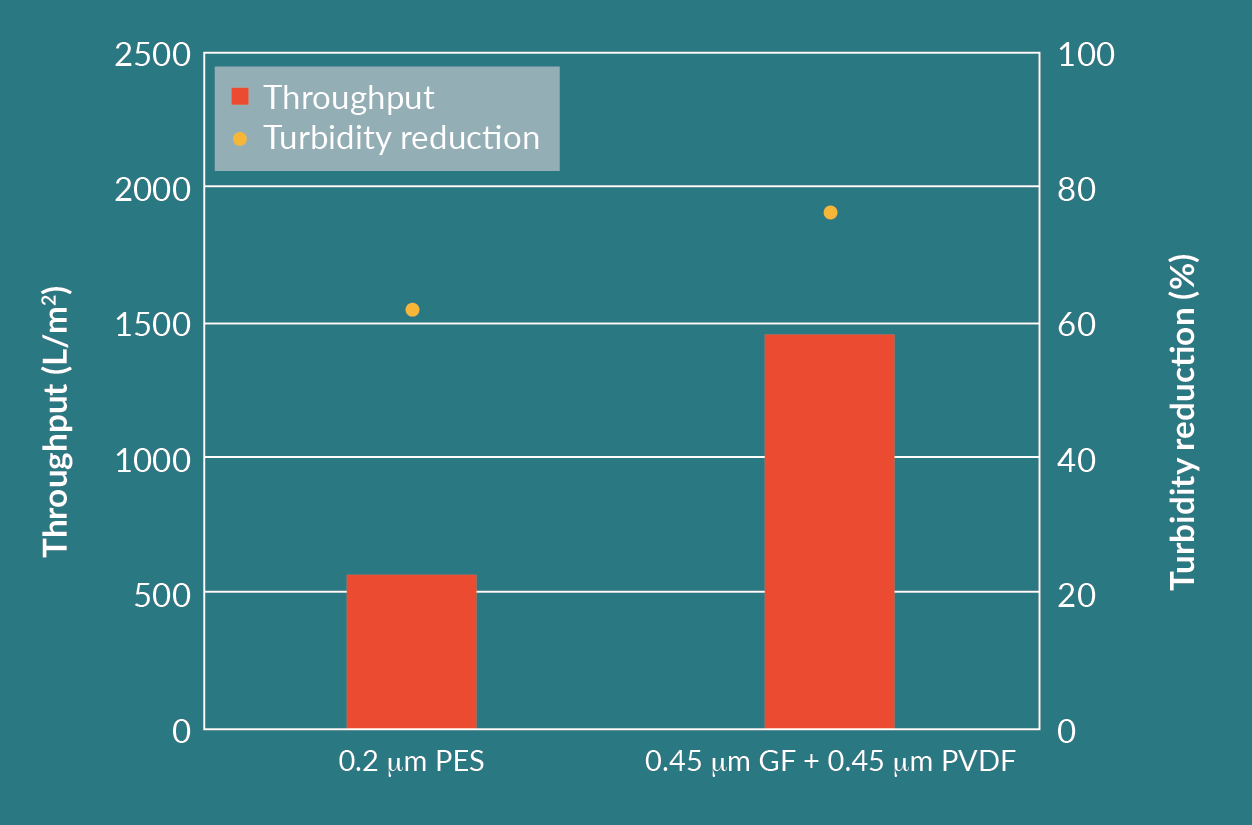
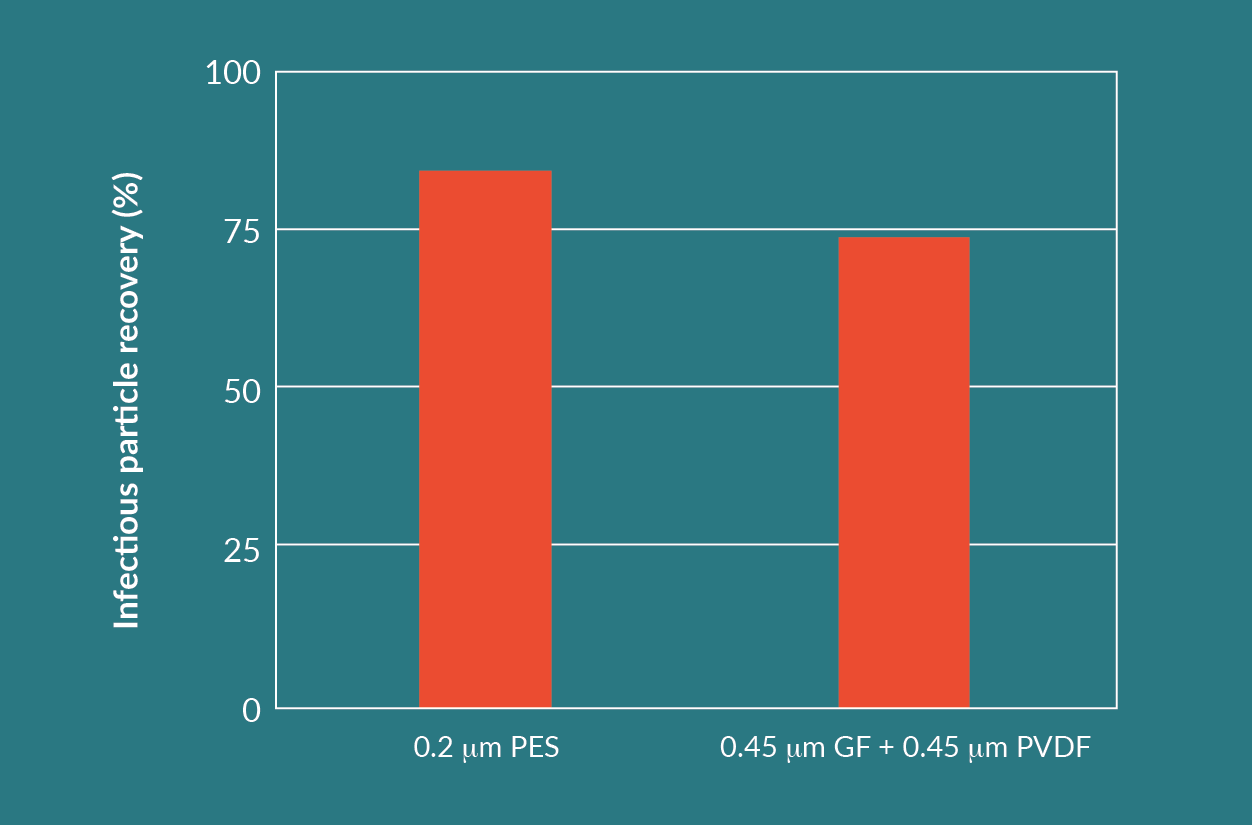
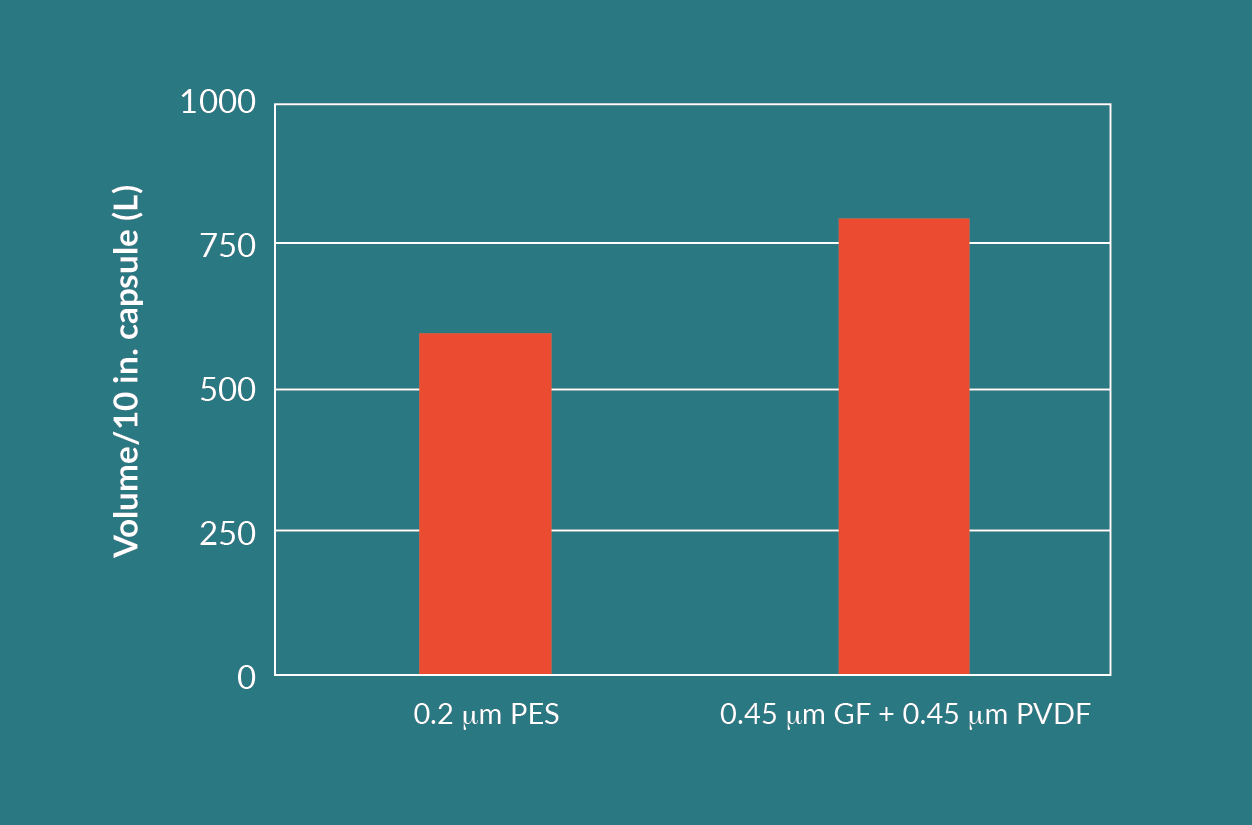
The difference in throughputs seen in Figure 7 is compensated for by the higher area per 254 mm (10 in.) module for the 0.2 µm PES membrane filter. The processed volumes per 254 mm (10 in.) module (Figure 9) are much closer to each other than throughputs from Figure 7.
Disposables for a single step filtration can potentially cost less than disposables for a dual step filtration. For this reason, both listed options are viable, but throughput, yield, and cost need to all be considered when making a choice.
Adeno-associated virus
The AAV suspension cell cultures in this study required a lysis step to release the virus from the cells prior to clarification. The combination of cells in suspension and the lysis step results in a significantly higher feed turbidity than an adherent cell culture process.
For this study, the first AAV cell culture tested had a turbidity of 430 NTU. The filtration experiments were stopped at a predetermined terminal differential pressure. Due to the higher feed turbidity, depth filters were selected for primary clarification step. Throughput and viral vector yield were measured for each filter. After depth filtration, each solution was filtered through a 0.2 µm membrane filter to reduce potential bioburden.
Figure 10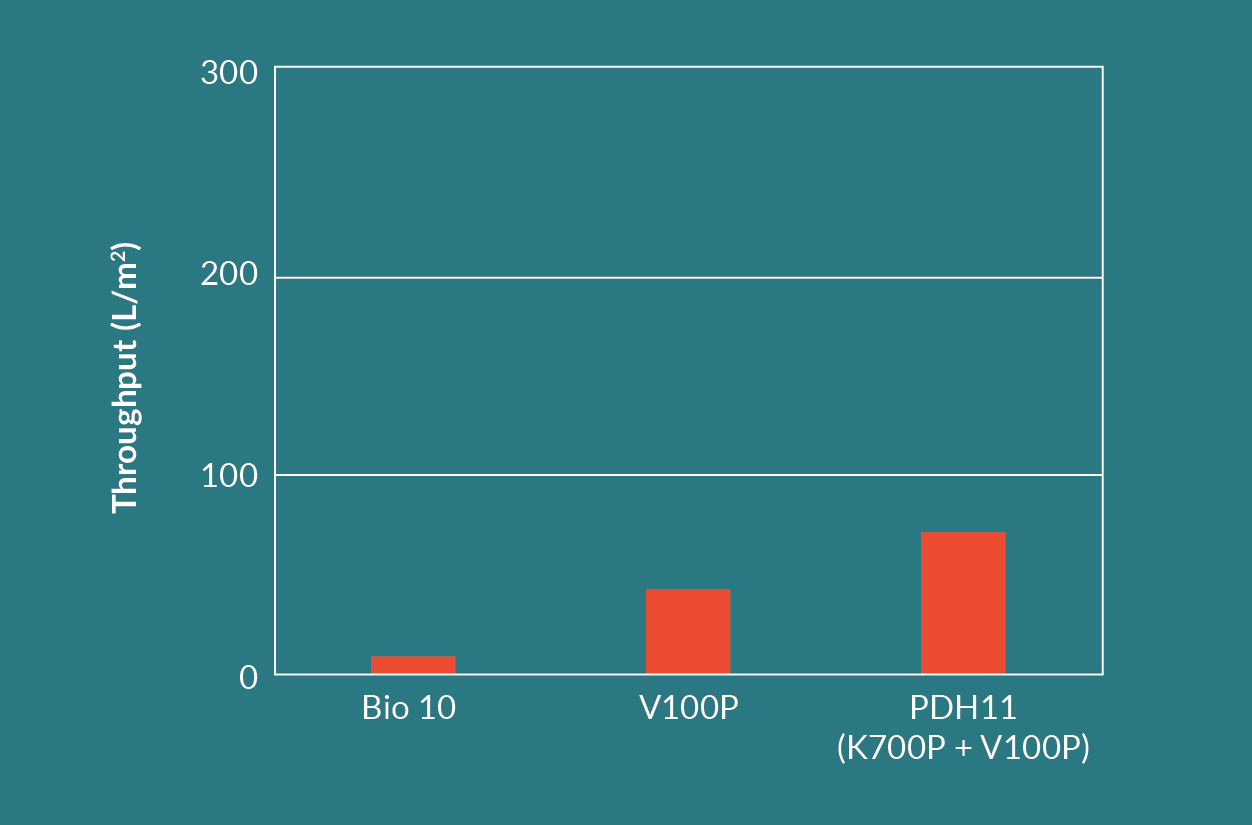
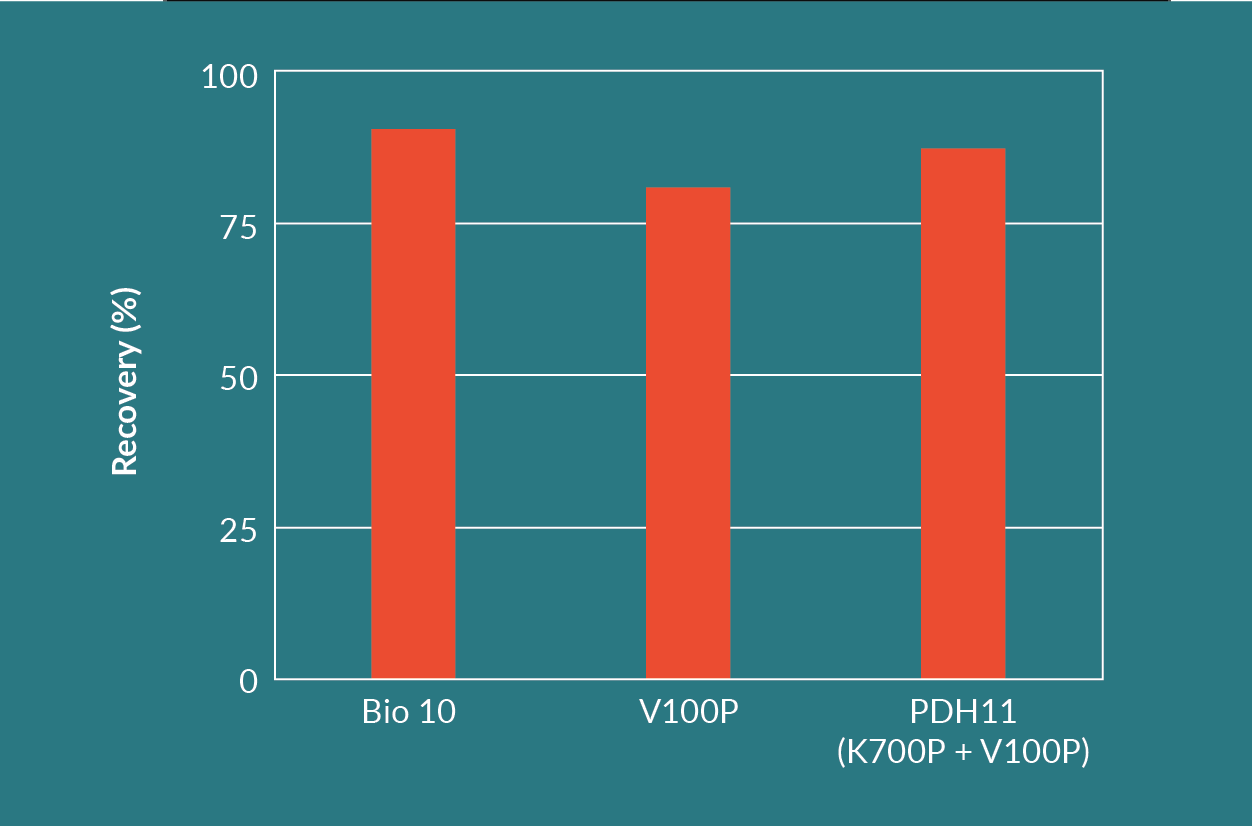
The Seitz HP PDH11 depth filter (Seitz K700P in series with Seitz V100P) had a high recovery similar to the Seitz Bio 10 filter. It also had the highest throughput of all three depth filter options. The Seitz K700P layer retained contaminants in the range of 6 to 15 µm and protected the finer Seitz V100P layer of the filter. This was evident when comparing the throughputs between the Seitz V100P alone versus the Seitz HP PDH11.
The Seitz Bio 10 filter showed the highest yield. Since the retention rating of the Seitz Bio 10 filter ranges from 0.2 to 0.4 µm, a second filtration test was performed to determine if a suitable coarser depth filter could protect the Seitz Bio 10 layer and improve the throughput without reducing the viral vector yield.
For the second test, an AAV cell culture with a feed turbidity of 540 NTU was used. The filtration experiments were stopped when the filter system reached a predetermined terminal differential pressure or no more feed material was available. Figure 12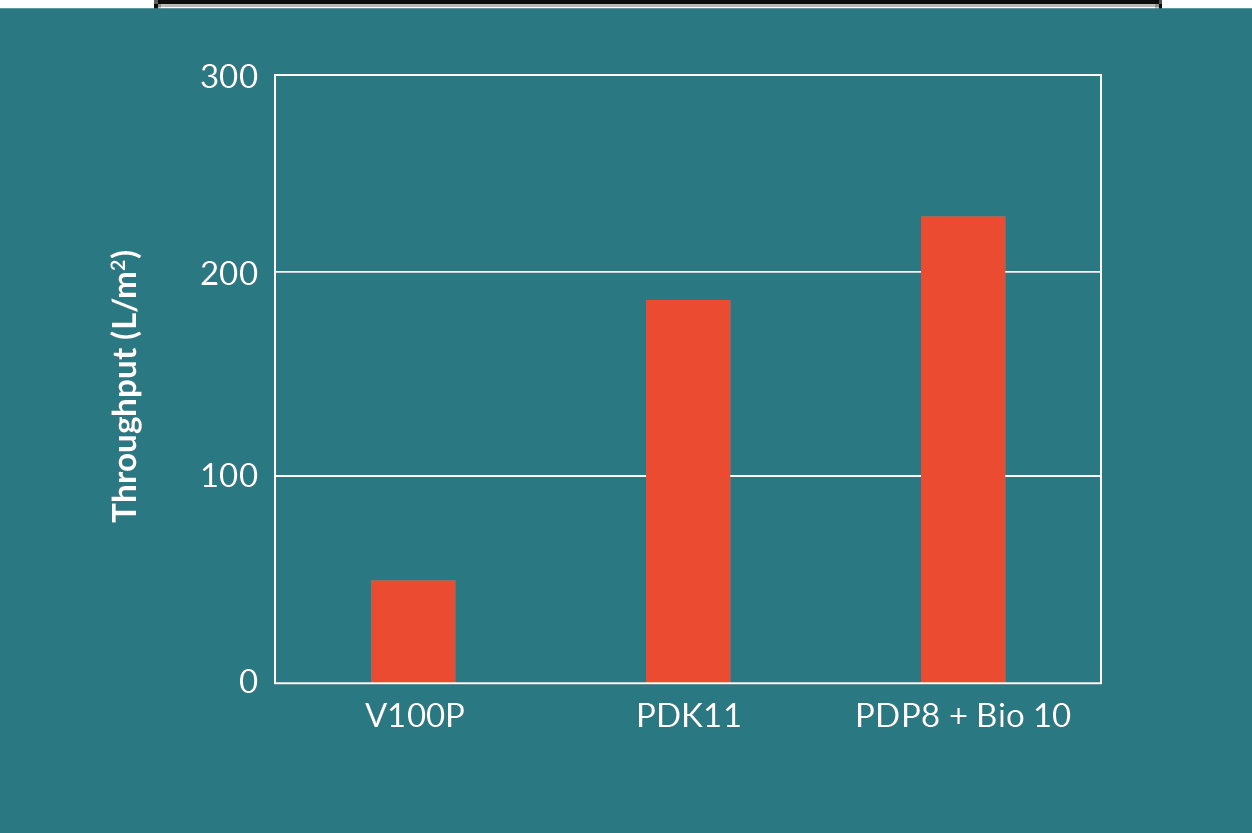
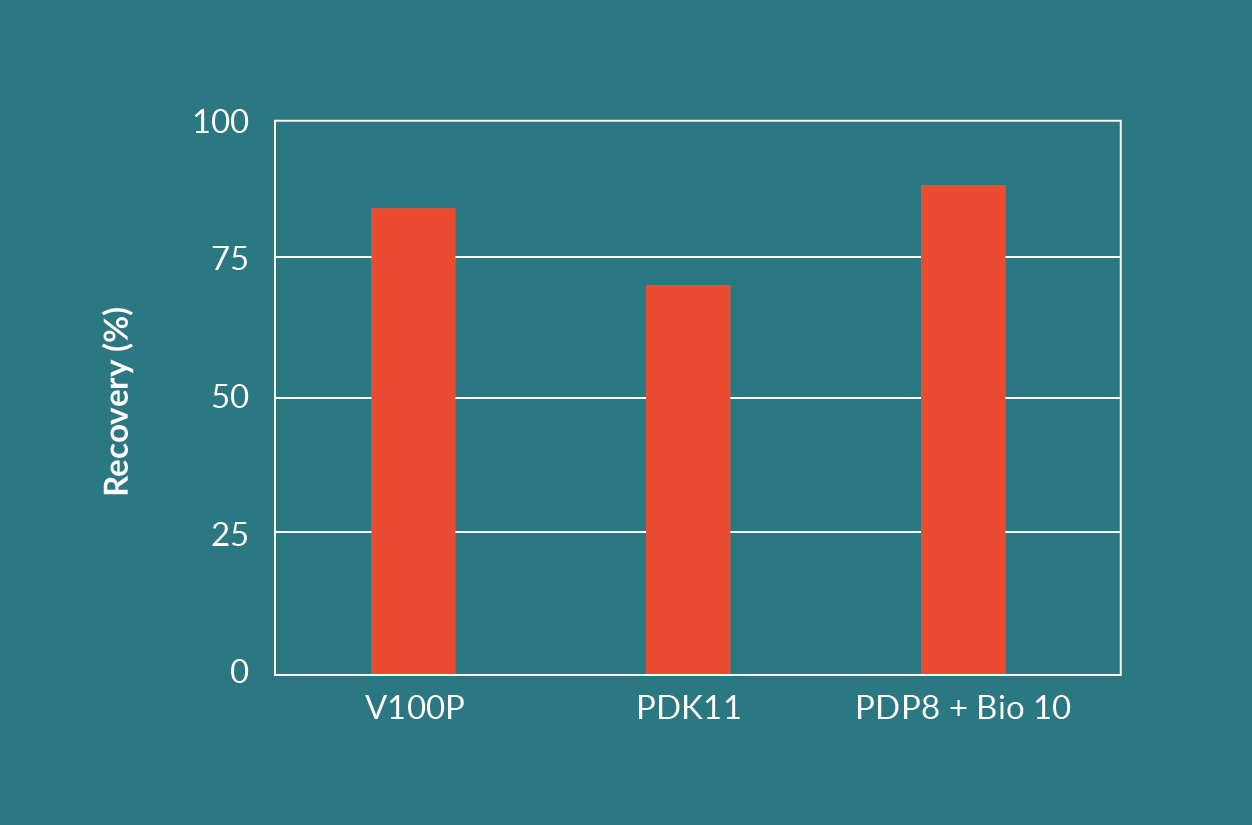
The combination of a Seitz HP PDP8 dual layer filter in series with a Seitz Bio 10 filter resulted in the highest throughput and the highest viral vector yield. The Seitz HP PDP8 dual layer filter is made up from a Seitz T1500P upstream, coarse layer and a Seitz K700P downstream, finer layer. The Seitz HP PDP8 protected the finer Seitz Bio 10 single layer filter and improved the throughput on the Seitz Bio 10. This is evident when comparing the throughput of the Seitz Bio 10 in Figure 10 versus the throughput of the Seitz HP PDP8 and Seitz Bio 10 combination in Figure 12.
The throughput of the Seitz HP PDP8 and Seitz Bio 10 combination was approximately five times higher than the Seitz V100P filter alone. The throughput of the dual layer Seitz HP PDK11 filter was approximately 4 times higher than the Seitz V100P filter alone.
Cost/efficiency analysis for AAV filtration
From an economical perspective, the filter area per capsule and the number of filtration steps are used to determine the ‘best’ filter system. Dual layer and single layer capsules look the same and have identical outer dimensions. Dual layer capsules, such as the Seitz HP PDH11, PDK11 and PDP8 media, contain half the EFA compared to the same size single layer depth filters such as the Seitz Bio 10 and V100P.
This implies that the throughput or yield of a dual layer combination needs to be higher than that of a single layer depth filter to make economic sense. This is the case for the Seitz HP PDK11 filter in comparison with the Seitz V100P filter. The Seitz HP PDK11 dual layer filter had approximately four times the throughput of the single layer Seitz V100P filter, while having an acceptable viral vector yield.
The combination of the dual layer Seitz HP PDP8 filter in series with the Seitz Bio 10 media is a two-step filtration. The cost of a two-step filtration can be higher when compared with a one-step filtration (the Seitz HP PDK11 dual layer filter). This implies that the throughput or yield of a two-step filtration needs to be higher than that of a single step filtration to make economic sense.
For the two-step filtration consisting of Seitz HP PDP8 and Seitz Bio 10, the throughput was approximately five times greater than the Seitz V100P (single step, single layer filter). This filter train also provided the highest yield, meaning this combination provides the best overall performance.
![]()
Conclusion
For the study shown here, an adherent based LV cell culture process and a suspension based AAV cell culture process were used to define an effective clarification strategy.
Depth filters, prefilters, and bioburden reduction membrane filters were considered for each application. The evaluation criteria included the following: throughput, turbidity reduction, volume that could be processed per 254 mm (10 in.) filter capsule, product yield, and the overall economics of the various proposed solutions.
For the clarification of the adherent LV process, the PES Supor EAV 0.2 µm filter and the combination of the PreFlow UB 0.45 µm GF prefilter in series with the Fluorodyne II DBL 0.45 µm PVDF membrane filter performed best among the filters tested, in terms of throughput and yield. The combination of the PreFlow UB filter in series with Fluorodyne II DBL filter generated a higher throughput than the Supor EAV filter alone. However, since it is a two-step filtration, disposables could potentially be more expensive than disposables for the single step filtration. For this reason, the method of clarification needs to be evaluated on a case by case basis where throughput, yield, and cost are all considered.
For the clarification of the suspension AAV feed, the dual layer, single step filter options of Seitz HP PDH11 and Seitz HP PDK11, as well as the triple layer, dual step combination of the Seitz HP PDP8 in series with the Seitz Bio 10, can all provide a viable clarification option for these applications.
Overall, the combination of the Seitz HP PDP8 filter in series with the Seitz Bio 10 filter showed the highest throughput, the highest yield, and is potentially the most economic option, albeit a two-stage process that introduces a somewhat more complex operation. The method of clarification needs to be evaluated on a case by case basis where throughput, yield, and cost are all considered.
Figure 14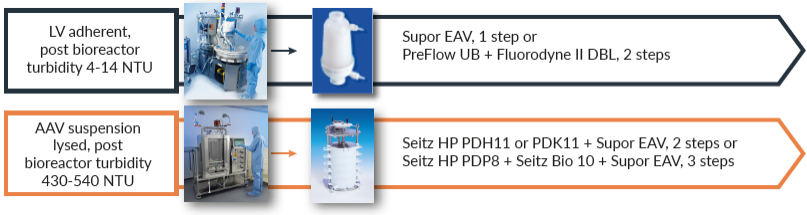
![]()
Authorship & Conflict of Interest
Contributions: All named authors take responsibility for the integrity of the work as a whole, and have given their approval for this version to be published.
Acknowledgements: The LV work was a collaborative effort of the Institute of Experimental Biology and Technology (iBET, Portugal), and Pall Corporation (USA). Special thanks to Cristina Peixoto and Tiago Faria of the iBET organization.
Disclosure and potential conflicts of interest: The authors disclose that Pall Corporation owns patents relevant to the Biotech Industry.
Funding declaration:The authors received no financial support for the research, authorship and/or publication of this article.
Article & copyright information
Copyright: Published by Cell and Gene Therapy Insights under Creative Commons License Deed CC BY NC ND 4.0 which allows anyone to copy, distribute, and transmit the article provided it is properly attributed in the manner specified below. No commercial use without permission.
Attribution: Copyright © 2019 Pall Corporation and Pall GmbH. Published by Cell and Gene Therapy Insights under Creative Commons License Deed CC BY NC ND 4.0.
Article source:Invited; externally peer reviewed.
Submitted for peer review: Sept 20 2019; Revised manuscript received: Oct 7 2019; Publication date: October 17 2019.
Reference
1. ARM 2018 State of the Industry; Website
Affiliations
Bharath Raghavan1, Mike Collins1, Stephanie Walls1, Alexander Lambropoulos1 & Silke Bergheim-Pietza2
1 Pall Biotech, 20 Walkup Drive, Westborough, MA 01581 USA
2 Pall Biotech, Philipp-Reis-Str. 6, D-63303 Dreieich Germany