
A simple RP-HPLC method for the stability-indicating determination of N-acetyl-L-cysteine and N,N’-diacetyl-L-cystine in cell culture media
Cell & Gene Therapy Insights 2020; 6(2), 303–323
10.18609/cgti.2020.041
N'-Acetyl-L-Cysteine (NAC) can exist in the reduced form, containing the sulfhydryl (-SH) group, and it can exist in its oxidized disulfide form N,N'-Diacetyl-L-Cystine (Di-NAC). However, an analytical method that can separate and quantify both compounds in cell treatment supplement media is not yet available, to the best of our knowledge. A stability-indicating RP-HPLC assay method for the determination of NAC and Di-NAC in the cell culture media has been developed. The proposed method showed good linearity for NAC (R = 1.00) and Di-NAC (R = 1.00), accuracy, precision, specificity and system suitability results within the acceptance criteria. The limit of detection and limit of quantitation were found to be 0.0001 mg/ml and 0.00018 mg/ml for NAC, and 0.00015 mg/ml and 0.00045 mg/ml for DI-NAC. However, our method can be used for the separation and quantification of NAC in cell treatment media, in vitro dissolution studies and pharmaceutical formulations.
N-Acetyl-L-Cysteine (NAC), commonly known as acetyl cysteine, is the amino acid derived from L-Cysteine (Cys) with an acetyl (-CO-CH3) group attached to the amino (NH2) group. It is widely used in clinical application as an antidote to acetaminophen overdose induced toxicity [1]Prescott LF. New approaches in managing drug overdosage and poisoning. BMJ 1983; 287(6387): 274–6., as a mucolytic agent in the treatment of respiratory disorders [2]Otu A, Langridge P, Denning D. Nebulised N-Acetylcysteine for Unresponsive Bronchial Obstruction in Allergic Brochopulmonary Aspergillosis: A Case Series and Review of the Literature. J. Fungi 2018; 4(4): 117. Authorship & Conflict of Interest, and to treat various oxidant-derived diseases such as chronic pulmonary diseases, cardiovascular diseases, neurodegenerative diseases, and cancer [3]Nigwekar SU, Kandula P. N-Acetylcysteine in Cardiovascular-Surgery–Associated Renal Failure: A Meta-Analysis. Ann. Thor. Surg. 2009; 87(1): 139-47.. Of interest in this research, is the utility of NAC as a supplement used in cell culture medium and a practical method for estimation of NAC and its oxidation degradation pathways in that medium. NAC has been elucidated to interact with numerous metabolic pathways including, regulation of the cell cycle and apoptosis, carcinogenesis and tumor progression, mutagenesis, gene expression and signal transduction, immune modulation, cytoskeleton organization and trafficking and mitochondrial functions [4]Huang R, Pan Q, Ma X et al. Hepatic Stellate Cell-Derived Microvesicles Prevent Hepatocytes from Injury Induced by APAP/H2O2. Stem Cells Int. 2016; 1–12., [5]Penugonda S, Mare S, Goldstein G, Banks WA, Ercal N. Effects of N-acetylcysteine amide (NACA), a novel thiol antioxidant against glutamate-induced cytotoxicity in neuronal cell line PC12. Brain Res. 2005; 1056(2): 132–8.. However, detecting NAC in a biological setting has been a challenge to overcome for researchers. NAC is quite stable thiol molecule. It is oxidized and degraded when in solution and exposed to air (USA Patent number, 5, 691.380, US 8,148,356 B2, US 8,399,445 B2). This oxidation easily and rapidly occurs via the disulfide (Figure 1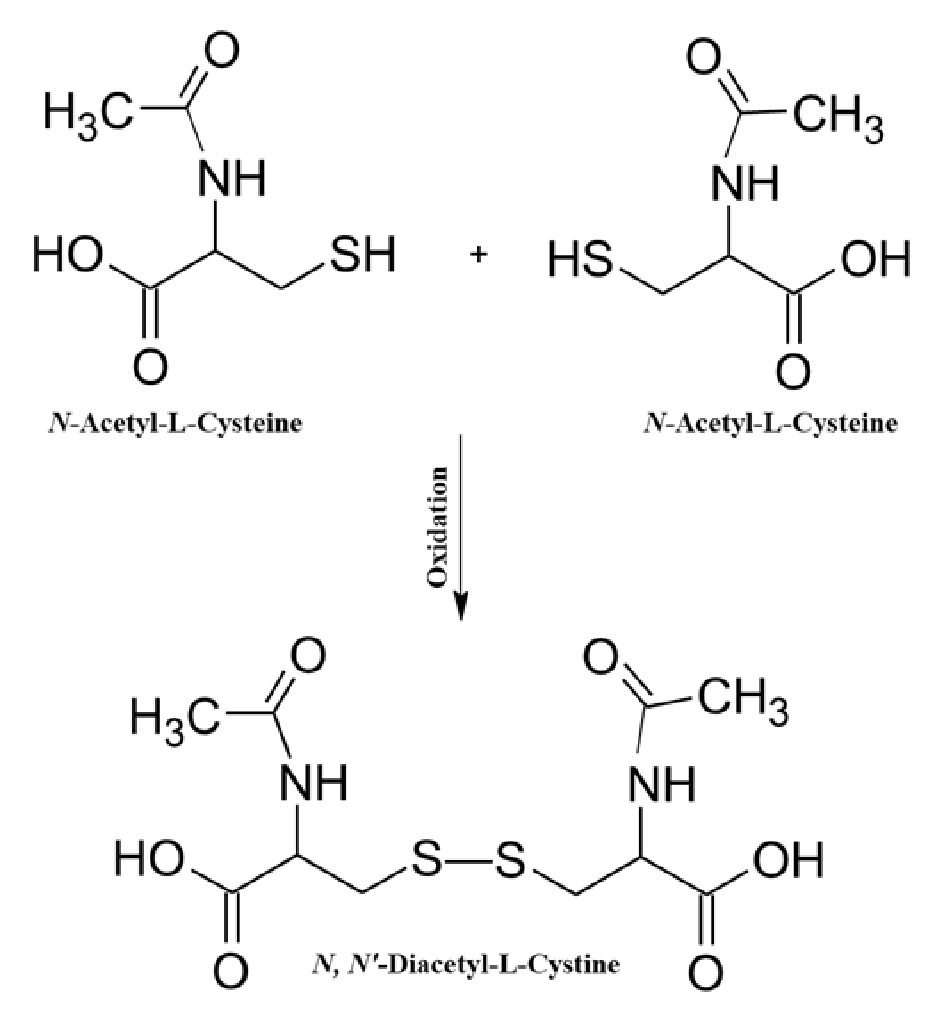
The acetyl group makes Cys more water-soluble, and functions to speed absorption and distribution on orally ingested Cys [7]Rehman SU, Vacek T, Ali A et al. Genes Or Dose, East Or West What Makes N Acetyl Cysteine Work? Meta-Analysis Of Nac Low Dose Vs High Dose Comparing Trials Done In Asian Population Vs European Population. American Journal of Respiratory and Critical Care Medicine; New York, 2016; 193: 1.Rehman SU, Vacek T, Ali A et al. Genes Or Dose, East Or West What Makes N Acetyl Cysteine Work? Meta-Analysis Of Nac Low Dose Vs High Dose Comparing Trials Done In Asian Population Vs European Population. American Journal of Respiratory and Critical Care Medicine; New York, 2016; 193: 1.. The acetyl group reduces the reactivity of the thiol (−SH), making NAC less toxic and less susceptible to oxidation than Cys [7]Rehman SU, Vacek T, Ali A et al. Genes Or Dose, East Or West What Makes N Acetyl Cysteine Work? Meta-Analysis Of Nac Low Dose Vs High Dose Comparing Trials Done In Asian Population Vs European Population. American Journal of Respiratory and Critical Care Medicine; New York, 2016; 193: 1.Rehman SU, Vacek T, Ali A et al. Genes Or Dose, East Or West What Makes N Acetyl Cysteine Work? Meta-Analysis Of Nac Low Dose Vs High Dose Comparing Trials Done In Asian Population Vs European Population. American Journal of Respiratory and Critical Care Medicine; New York, 2016; 193: 1.. It is a small, water-soluble [8]National Center for Biotechnology Information. PubChem Database. Acetylcysteine, CID=12035: https://pubchem.ncbi.nlm.nih.gov/compound/Acetylcysteine , membrane-permeable [9]Sen CK. Nutritional biochemistry of cellular glutathione. J. Nutr. Biochem. 1997; 8(12): 660–72.Sen CK. Nutritional biochemistry of cellular glutathione. J. Nutr. Biochem. 1997; 8(12): 660–72. and can cross the blood–brain barrier (BBB) [10]Bavarsad Shahripour R, Harrigan MR, Alexandrov AV. N-acetylcysteine (NAC) in neurological disorders: mechanisms of action and therapeutic opportunities. Brain Behavior 2014; 4(2): 108–22.Bavarsad Shahripour R, Harrigan MR, Alexandrov AV. N-acetylcysteine (NAC) in neurological disorders: mechanisms of action and therapeutic opportunities. Brain Behavior 2014; 4(2): 108–22. NAC is a membrane-permeable cysteine precursor that does not require active transport to deliver cysteine to the cell [9]Sen CK. Nutritional biochemistry of cellular glutathione. J. Nutr. Biochem. 1997; 8(12): 660–72.Sen CK. Nutritional biochemistry of cellular glutathione. J. Nutr. Biochem. 1997; 8(12): 660–72.. Once NAC is inside the cells it is rapidly hydrolyzed, then cytosolic acylase I deacetylates NAC (Figure 2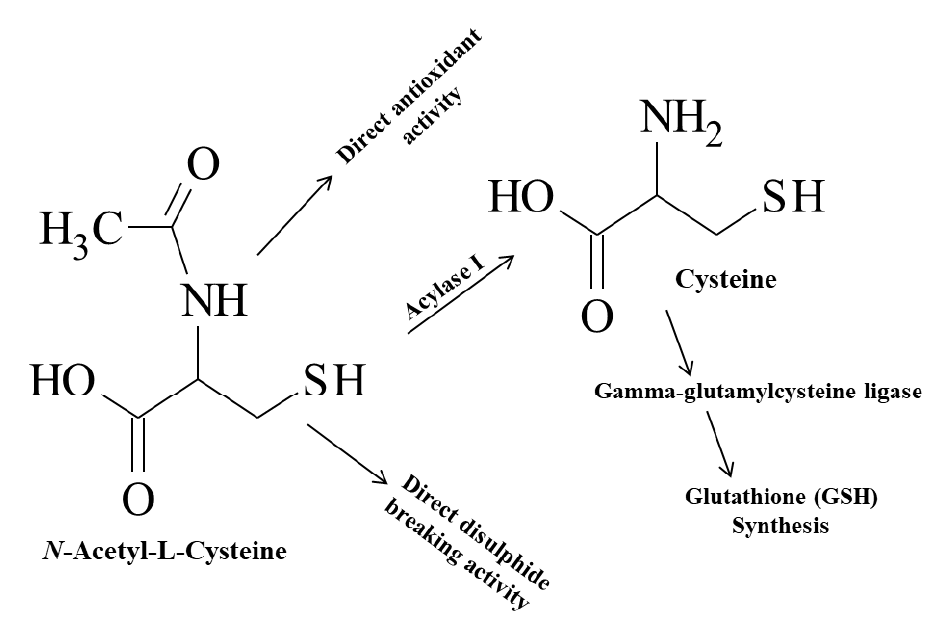
Many studies show that NAC, a well-known antioxidant, has been used as an antioxidant in a wide variety of experiments and shows antioxidant activity in both cell-free and in cell systems [15]Raffaele M, Barbagallo I, Licari M et al. N-Acetylcysteine (NAC) Ameliorates Lipid-Related Metabolic Dysfunction in Bone Marrow Stromal Cells-Derived Adipocytes. Evid. Based Complement. Alt. Med. 2018; 1–9.. The broad application of NAC is not only because of its well-described antioxidant and radical scavenging activity but also because, as a thiol molecule, it is quite stable, commercially available, and inexpensive. NAC exhibits antioxidant properties through the interaction of its free thiol group with the electrophilic groups of ROS [16]Kerksick C, Willoughby D. The Antioxidant Role of Glutathione and N-Acetyl-Cysteine Supplements and Exercise-Induced Oxidative Stress. J. Int. Soc. Sports Nutr. 2005; 2(2). and nitrogen species as a scavenger of oxygen free radicals [17]Zafarullah M, Li WQ, Sylvester J, Ahmad M. Molecular mechanisms of N -acetylcysteine actions. Cell. Mol. Life Sci. 2003; 60(1): 6–20.. Antioxidant activity of NAC primarily acts to scavenge hydroxyl radical (HO∙) and hypochlorous acid (HOCl), but also reacts with hydrogen peroxide (H2O2) [18]Aruoma OI, Halliwell B, Hoey BM, Butler J. The antioxidant action of N-acetylcysteine: Its reaction with hydrogen peroxide, hydroxyl radical, superoxide, and hypochlorous acid. Free Radic. Biol. Med. 1989; 6(6): 593–7. and superoxide (O2∙-) [19]Benrahmoune M, Thérond P, Abedinzadeh Z. The reaction of superoxide radical with N-acetylcysteine. Free Radic. Biol. Med. 2000; 29(8): 775–82.. It does not react with O2 and nitric oxide (NO) [20]Tardiolo G, Bramanti P, Mazzon E. Overview on the Effects of N-Acetylcysteine in Neurodegenerative Diseases. Molecules 2018; 23(12): 3305.. Furthermore, it can serve as a metal chelating agent for several toxic metals such as cobalt, boron, cadmium, lead, and arsenic [21]Al-Ghannam SM, El-Brashy AM, Al-Farhan BS. Fluorimetric determination of some thiol compounds in their dosage forms. Il Farmaco. 2002; 57(8): 625–9..
NAC has been used as a component of supplement and expansion medium for the treatment of cells, but at higher concentration NAC decreases cell viability [22]Mitsopoulos P, Suntres ZE. Protective Effects of Liposomal N-Acetylcysteine against Paraquat-Induced Cytotoxicity and Gene Expression. J. Toxicol. 2011; 1–14.. Stability testing studies of NAC in cell culture media, active pharmaceutical ingredient (API), and pharmaceutical formulation provide evidence of the intrinsic stability of the molecule in response to environmental conditions, e.g., air, temperature, humidity, and light. Consequently, there is extensive established stability and shelf life for NAC [23]Ellis AG, Ching MS, Shilson AD, Kong DCM, Garrett K. Stability of a Formulated N‐acetylcysteine Capsule for Prevention of Contrast‐Induced Nephropathy. J. Pharm. Pract. Res. 2015. .
In the past for the quantitative determination of NAC several analytical methods such as fluorimetry [24]Bartolomeo MP, Maisano F. Validation of a reversed-phase HPLC method for quantitative amino acid analysis. J. Biomol. Tech. 2006; 17(2): 131–7., HPLC [25]Wu W, Goldstein G, Adams C, Matthews RH, Ercal N. Separation and quantification ofN-acetyl-l-cysteine andN-acetyl-cysteine-amide by HPLC with fluorescence detection. Biomed. Chromatograph. 2006; 20(5): 415–22. , potentio-metry [26]Martinović A, Radić N. Kinetic Potentiometric Determination of some Thiols with Iodide Ion‐Sensitive Electrode. Anal. Lett. 2007; 40(15): 2851–9., spectrophotometry [27]Alvarez-Coque MCG, Hernández MJM, Camañas RMV, Fernández CM. Spectrophotometric determination of N-acetylcysteine in drug formulations with o-phthalaldehyde and isoleucine. The Analyst 1989; 114(8): 975–7., [28]Kukoc-Modun L, Radic N. Kinetic Spectrophotometric Determination of N-Acetyl-L-cysteine Based on a Coupled Redox-Complexation Reaction. Anal. Sci. 2010; 26(4): 491–5., colorimetry [29]Raggi MA, Cavrini V, Di Pietra AM. Colorimetric Determination of Acetylcysteine, Penicillamine, and Mercaptopropionylglycine in Pharmaceutical Dosage Forms. J. Pharmaceut. Sci. 1982; 71(12): 1384–6. , [30]Ogwu V, Cohen G. A Simple Colorimetric Method for the Simultaneous Determination of N-Acetylcysteine and Cysteine. Free Radic. Biol. Med. 1998; 25(3): 362–4., chemiluminiscence [31]Li H, Du J. Sensitive Chemiluminescence Determination of Three Thiol Compounds Based on Cu(II)-Catalyzing Luminol Reaction in the Absence of an Oxidant. Anal. Lett. 2009; 42(13): 2131–40., electrochemical detection [32]Shaidarova LG, Gedmina AV, Zhaldak ER, Chelnokova IA, Budnikov GK. Voltammetric Determination of Acetylcysteine in Drugs Using an Electrode Modified by an Osmium Hexacyanocobaltate Film. Pharmaceut. Chem. J. 2014; 47(12): 670–4., [33]Silva ISd, Araújo MFA, Ferreira HA et al. Quantification of N-acetylcysteine in pharmaceuticals using cobalt phthalocyanine modified graphite electrodes. Talanta 2011; 83(5): 1701–6., turbidimetry and nephlometry [34]Santos VBd, Guerreiro TB, Suarez WT, Faria RC, Fatibello-Filho O. Evaluation of turbidimetric and nephelometric techniques for analytical determination of n-acetylcysteine and thiamine in pharmaceutical formulations employing a lab-made portable microcontrolled turbidimeter and nephelometer. J. Brazil. Chem. Soc. 2011; 22(10): 1968–78., liquid chromatography tandem mass spectrometry [35]Lu C, Liu G, Jia J et al. Liquid chromatography tandem mass spectrometry method for determination of N-acetylcysteine in human plasma using an isotope-labeled internal standard. Biomed. Chromatography 2011; 25(4): 427–31. , gas chromatography mass spectrometry [36]Longo A, Di Toro M, Galimberti C, Carenzi A. Determination of N-acetylcysteine in human plasma by gas chromatography—mass spectrometry. J. Chromatography B 1991; 562(1–2): 639–45. and capillary electrophoresis [37]Dette C, Wätzig H. Separation of enantiomers of N-acetylcysteine by capillary electrophoresis after derivatization byo-phthaldialdehyde. Electrophoresis 1994; 15(1): 763–8., [38]Jaworska M, Szulińska G, Wilk M, Tautt J. Capillary electrophoretic separation of N-acetylcysteine and its impurities as a method for quality control of pharmaceuticals. J. Chromatography A 1999; 853(1–2): 479–85. have been employed. It has been simultaneously quantified along with other substances like clomiphene citrate [39]Chanduluru Hemanth Kumar GU, Santha Arcot. Method development and validation for simultaneous assessment of clomiphene citrate and n-acetyl cysteinein mixed tablet dosage form by RP-UPLC. WJPPS 2014; 3(3): 1773–80, arginine [40]Jyothi N, Pasha S. Development and Validation of a New Rp-Hplc Method For Simultaneous Estimation of N-Acetylcysteine and L – Arginine in Combined Dosage form. Orient. J. Chem. 2014; 30(3): 1371–8., and cefexime trihydrate [41]Dabir J, Mathew EM, Moorkoth S. Analytical Method Development and Validation of RP-HPLC Method for Simultaneous Estimation of N-acetyl cysteine and Cefexime from its Fixed Dose Combination. Res. J. Pharm. Technol. 2016; 9(7): 835. Dabir J, Mathew EM, Moorkoth S. Analytical Method Development and Validation of RP-HPLC Method for Simultaneous Estimation of N-acetyl cysteine and Cefexime from its Fixed Dose Combination. Res. J. Pharm. Technol. 2016; 9(7): 835. . Its related substances have been described by the European pharmacopoeia and British pharmacopoeia as L-cystine, L-cysteine, N, N'-diacetylcystine and N, S diacetylcysteine [42]The European Directorate for the Quality of Medicines and HealthCare, European Pharmacopoeia, and British Pharmacopoeia. Pharmaceutical Medicine: Oxford University Press; 2013; 34–6.The European Directorate for the Quality of Medicines and HealthCare, European Pharmacopoeia, and British Pharmacopoeia. Pharmaceutical Medicine: Oxford University Press; 2013; 34–6.. Among chromatographic methods in the literature, separation methods like RP-HPLC and ion pair chromatography for related substances have been used in tests of NAC in bulk products [41]Dabir J, Mathew EM, Moorkoth S. Analytical Method Development and Validation of RP-HPLC Method for Simultaneous Estimation of N-acetyl cysteine and Cefexime from its Fixed Dose Combination. Res. J. Pharm. Technol. 2016; 9(7): 835. Dabir J, Mathew EM, Moorkoth S. Analytical Method Development and Validation of RP-HPLC Method for Simultaneous Estimation of N-acetyl cysteine and Cefexime from its Fixed Dose Combination. Res. J. Pharm. Technol. 2016; 9(7): 835. , [42]The European Directorate for the Quality of Medicines and HealthCare, European Pharmacopoeia, and British Pharmacopoeia. Pharmaceutical Medicine: Oxford University Press; 2013; 34–6.The European Directorate for the Quality of Medicines and HealthCare, European Pharmacopoeia, and British Pharmacopoeia. Pharmaceutical Medicine: Oxford University Press; 2013; 34–6.. Other less widely available techniques like LC-UV-MS [43]Jaworska M, Szulińska G, Wilk M, Tautt J. Capillary electrophoretic separation of N-acetylcysteine and its impurities as a method for quality control of pharmaceuticals. J. Chromatography A 1999; 853(1): 479–85. and capillary electrophoresis-mass spectrometry [44]Toussaint B, Pitti C, Streel B, Ceccato A, Hubert P, Crommen J. Quantitative analysis of N-acetylcysteine and its pharmacopeial impurities in a pharmaceutical formulation by liquid chromatography–UV detection–mass spectrometry. J. Chromatography A 2000; 896(1–2): 191–9. have been used for quantifying the related substances of NAC. However, to our knowledge, there is no analytical method in the literature that determines NAC stability and concentration during its use in cells treatment. A method of analysis that enables accurate quantification and stability determination of NAC under those conditions typical of cell growth, expansion and expression was therefore needed.
Various cell culture media commonly contain other low molecular weight thiols such as Cys, Cystine and glutathione. Therefore, any analytical method typically faces challenges in distinguishing between NAC and these other species, which have similar physical and chemical properties [45]Kinjawadekar V, Boddu S, Ghadge O. A novel stability indicating rp-hplc method for the simultaneous estimation of n-acetylcysteine and ambroxol in combined tablet dosage form. IJPSR 2017; 8(8): 2161–7.. One way this has been overcome is through RP-HPLC methods, which retain reduced NAC as a stable, detectable molecule [46]Sana S, Rajani A, Sumedha N, Pravin P, Shripad N. Development and Validation of RP-HPLC Method for the Estimation of NAcetylcysteine in Wet Cough Syrup. Int. J. Drug Dev. Res. 2012; 4(2): 284–93.. The literature survey reveals that a few stability indicating RP-HPLC methods for NAC are available [47]Ercal N, Oztezcan S, Hammond TC, Matthews RH, Spitz DR. High-performance liquid chromatography assay for N-acetylcysteine in biological samples following derivatization with N-(1-pyrenyl)maleimide. J. Chromatography B 1996; 685(2): 329–34., [48]Johansson M, Lenngren S. Determination of cysteine, glutathione and N-acetylcysteine in plasma by ion-pair reversed-phase liquid chromatography and post-column derivatization. J. Chromatography B 1988; 432: 65–74. but all these methods are specific to formulation compositions which are far different from those used in common commercial formulated media and of those developed in our laboratory and used in cell treatment.
The purpose of this study was to examine the stability of the NAC content in a cell culture media. Hence, it was necessary for the present study to investigate stability-indicating RP-HPLC method for the determination of NAC in DMEM cell culture media. The present analytical work describes an accurate, specific, and repeatable. This method was validated according to International Council for Harmonization (ICH) guidelines.
Experimental procedures
Reagents & chemicals
N-Acetyl-L-Cysteine was purchased from Alfa Aesar (Tewksbury, MA, USA), N, N-Diacetyl-L-Cystine was purchased from Santa Cruz Biotechnology (Dallas, Texas, USA), Acetonitrile was received from Fisher Scientific (Middletown, VA, USA), Trifluoroacetic Acid, HPLC Grade was purchased from JT Baker (Fail Lawn, USA), Orthophosphoric acid, HPLC grade was purchased from EMD Millipore (Burlington, MA, USA) and Dulbecco’s modified Eagle’s medium F12 (1:1) nutrient mixture F-12 (Ham) was purchased from Thermofisher (Greenville, NC, USA). Milli-Q® water for solutions made in house with a Milli-Q® system (Millipore, Milford, MA, USA). All other chemicals were obtained in an analytical grade or from standard commercial suppliers. Mobile phase was used as the diluent.
Placebo preparation
Placebos are an important methodological tool, used in research studies testing drugs in vitro and in vivo. Dulbecco’s modified Eagle’s medium (DMEM) is now extensively used in culturing a wide variety of mammalian cell types, cell lines and treatment of cells [49]Yedjou CG, Tchounwou CK, Haile S, Edwards F, Tchounwou PB. N-Acetyl-Cysteine Protects Against DNA Damage Associated with Lead Toxicity in HepG2 Cells. Ethn Dis. 2010; 20(1 Suppl. 1): S1–101-3.Yedjou CG, Tchounwou CK, Haile S, Edwards F, Tchounwou PB. N-Acetyl-Cysteine Protects Against DNA Damage Associated with Lead Toxicity in HepG2 Cells. Ethn Dis. 2010; 20(1 Suppl. 1): S1–101-3.Yedjou CG, Tchounwou CK, Haile S, Edwards F, Tchounwou PB. N-Acetyl-Cysteine Protects Against DNA Damage Associated with Lead Toxicity in HepG2 Cells. Ethn Dis. 2010; 20(1 Suppl. 1): S1–101-3.. It provides a buffering system and maintains the physiological pH range and osmotic balance of the culture medium. It is also a source of water, essential and non-essential amino acids, vitamins, organic and inorganic ions, and energy for cells. It is common to purchase and use commercial media. In this present study DMEM medium was considered as a placebo for NAC stability assay.
Instrumentation & chromatographic conditions
The reverse phase high-performance liquid chromatographic (RP-HPLC) method development and complete partial validation studies was performed with a Waters alliance 2695 Separations Module, comprised of a quaternary pump solvent delivery module, online degasser, thermostated, column compartment, Waters external column heater, auto sampler, auto injector (Model Code SM4) with 100 µl injection loop, and a diode-array detector (DAD 2487). Samples were maintained at 5 °C in the autosampler prior to analysis. System suitability parameters were tested to show that the system was working accurately during the analysis. The system was used in a room temperature HPLC laboratory (20 ± 2 °C). The analysis was performed on a C18 column (YMC-Pack Pro C18, 250 X 4.6, S-5 μm, 12 nm) under reversed-phase partition chromatographic conditions. RP-HPLC method development process utilized an isocratic elution method with a mobile phase composed of Acetonitrile (ACN) and water (4:96 v/v) containing 0.1% TFA at a flow rate of 1.0 ml/min. Injection volume was kept constant 20 μl and column temperature was maintained at 25 °C. The detection of NAC and Di-NAC was monitored at an UV wavelength of 212 nm. Chromatogram output, integration of peaks, calculation of peak areas, retention times and system suitability parameters such as peak asymmetry and column efficiency etc. were obtained using the Empower software, version 3.
Preparations of standard & placebo sample solutions for HPLC analysis
Preparation of NAC & Di-NAC standard solutions
A stock solution of NAC and Di-NAC standard for method development was prepared by accurately weighed out 50 mg of NAC and Di-NAC transferred into separate 25 ml of volumetric flasks. Each was dissolved in mobile phase, and diluted to a final volume of 25 ml with mobile phase. From these stock solutions, working standard and calibration stock solutions were prepared. The working standard solutions of 0.005 mg/ml were prepared by transferring 0.125 ml of stock NAC and Di-NAC solutions into separate 50 ml volumetric flasks and diluting to volume with mobile phase.
Preparation of NAC & Di-NAC linearity standard solutions
A calibration standard stock solution of NAC and Di-NAC was prepared. A volume of 100 µl of NAC and Di-NAC stock solutions was transferred into separate 20 ml volumetric flasks and diluted to the mark with a mobile phase. According to ICH [50]ICH Q2 (R1), “Validation of analytical procedures: text and methodology,” in Proceedings of the International Conference on Harmonization, Geneva, Switzerland, 2005; November: 1-13.ICH Q2 (R1), “Validation of analytical procedures: text and methodology,” in Proceedings of the International Conference on Harmonization, Geneva, Switzerland, 2005; November: 1-13.ICH Q2 (R1), “Validation of analytical procedures: text and methodology,” in Proceedings of the International Conference on Harmonization, Geneva, Switzerland, 2005; November: 1-13.ICH Q2 (R1), “Validation of analytical procedures: text and methodology,” in Proceedings of the International Conference on Harmonization, Geneva, Switzerland, 2005; November: 1-13.ICH Q2 (R1), “Validation of analytical procedures: text and methodology,” in Proceedings of the International Conference on Harmonization, Geneva, Switzerland, 2005; November: 1-13.ICH Q2 (R1), “Validation of analytical procedures: text and methodology,” in Proceedings of the International Conference on Harmonization, Geneva, Switzerland, 2005; November: 1-13.ICH Q2 (R1), “Validation of analytical procedures: text and methodology,” in Proceedings of the International Conference on Harmonization, Geneva, Switzerland, 2005; November: 1-13.ICH Q2 (R1), “Validation of analytical procedures: text and methodology,” in Proceedings of the International Conference on Harmonization, Geneva, Switzerland, 2005; November: 1-13. guidelines, for the linearity assay a minimum of 5 concentrations is recommended. Six linearity standard solutions were then prepared by diluting from calibration standard stock solutions with mobile phase to yield varying concentrations over a range of 0.0003, 0.0006, 0.002, 0.005, 0.0075 and 0.01 mg/ml. These standard solutions were used to perform the analysis of calibration curve. The linearity was established by calculating the coefficient of determination (R2) value for NAC and Di-NAC, separately.
Limit of detection & limit of quantification
Limit of detection (LOD) is defined as the smallest amount of analyte in the test sample that can be reliably distinguished from zero. The LOD and limit of quantification (LOQ) were calculated mathematically by the relationship between the standard error (σ) of the calibration curve and its slope (S) using the multiplier according to ICH [50]ICH Q2 (R1), “Validation of analytical procedures: text and methodology,” in Proceedings of the International Conference on Harmonization, Geneva, Switzerland, 2005; November: 1-13.ICH Q2 (R1), “Validation of analytical procedures: text and methodology,” in Proceedings of the International Conference on Harmonization, Geneva, Switzerland, 2005; November: 1-13.ICH Q2 (R1), “Validation of analytical procedures: text and methodology,” in Proceedings of the International Conference on Harmonization, Geneva, Switzerland, 2005; November: 1-13.ICH Q2 (R1), “Validation of analytical procedures: text and methodology,” in Proceedings of the International Conference on Harmonization, Geneva, Switzerland, 2005; November: 1-13.ICH Q2 (R1), “Validation of analytical procedures: text and methodology,” in Proceedings of the International Conference on Harmonization, Geneva, Switzerland, 2005; November: 1-13.ICH Q2 (R1), “Validation of analytical procedures: text and methodology,” in Proceedings of the International Conference on Harmonization, Geneva, Switzerland, 2005; November: 1-13.ICH Q2 (R1), “Validation of analytical procedures: text and methodology,” in Proceedings of the International Conference on Harmonization, Geneva, Switzerland, 2005; November: 1-13.ICH Q2 (R1), “Validation of analytical procedures: text and methodology,” in Proceedings of the International Conference on Harmonization, Geneva, Switzerland, 2005; November: 1-13. guidelines. This approach is mainly used in chromatographic methods. Modern chromatography programs determine this value automatically. The Calibration curve was constructed by plotting peak area against the corresponding concentrations. The LOD and LOQ were calculated by Equations 1 and 2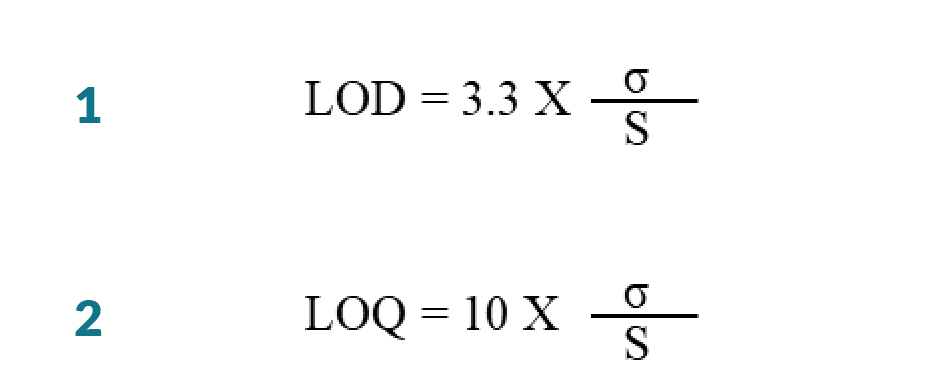
Preparation of placebo sample solution for stability
To determine the placebo component’s effect on the NAC stability, placebo sample stock solution was prepared by accurately weighed out 50 mg of NAC into a 25 ml of volumetric flask. Material was then dissolved in DMEM, and diluted to a final volume of 25 ml with DMEM. For stability analysis placebo sample solution at concentration 0.005 mg/ml was prepared by pipetting 0.125 ml of above placebo sample stock solution into a 50 ml volumetric flask and diluted to the mark with a mobile phase. The stability was assessed with placebo sample and NAC standard solutions were incubated at room temperature (RT) (20 ± 2 °C) and 37 °C for 24 and 48 h, whereby the effect of NAC oxidation was determined. The solutions were injected separately and the content of NAC was determined by comparing the peak area of the freshly prepared placebo sample with that of fresh NAC standard, for 24 h interval up to 48 h.
Stability of NAC in DMEM cell culture media
While much work has been done to understand the impact of NAC product formulation on stability, there is limited understanding of the link between cell culture process conditions and soluble Di-NAC formation in NAC product. Further, to understand stability of NAC in cell treatment DMEM [49]Yedjou CG, Tchounwou CK, Haile S, Edwards F, Tchounwou PB. N-Acetyl-Cysteine Protects Against DNA Damage Associated with Lead Toxicity in HepG2 Cells. Ethn Dis. 2010; 20(1 Suppl. 1): S1–101-3.Yedjou CG, Tchounwou CK, Haile S, Edwards F, Tchounwou PB. N-Acetyl-Cysteine Protects Against DNA Damage Associated with Lead Toxicity in HepG2 Cells. Ethn Dis. 2010; 20(1 Suppl. 1): S1–101-3.Yedjou CG, Tchounwou CK, Haile S, Edwards F, Tchounwou PB. N-Acetyl-Cysteine Protects Against DNA Damage Associated with Lead Toxicity in HepG2 Cells. Ethn Dis. 2010; 20(1 Suppl. 1): S1–101-3., pH 7.5, accurately weighed out 50 mg of NAC into a 25 ml of volumetric flask. Material was then dissolved in DMEM, and diluted to a final volume of 25 ml with DMEM. The solution was split into three portions immediately after preparation. One portion was stored at RT (20 ± 2 °C), second portion was stored under refrigeration (2–8 °C) and the third portion was directly incubated at 37 °C for 24 h. DMEM matrix, temperature and pH 7.5 effect stability of NAC were conducted, whereby the effect of pH and temperature on NAC oxidation was determined. After incubation all three solutions were diluted to concentration 0.005 mg/ml with mobile phase. The solutions were injected separately and the content of NAC and formation of Di-NAC was determined by comparing the peak area of the freshly prepared NAC in DMEM and immediately diluted with mobile phase, NAC and Di-NAC standards in mobile phase.
Specificity
Specificity is the ability of a method to measure the analyte response in the presence of all potential impurities and placebo components. To study whether any interfering peaks co-elute at or near the NAC and Di-NAC peaks, DMEM was diluted with mobile phase. The specificity of the analytical method was assessed by injecting a diluted DMEM (placebo), Milli-Q® water and NAC and Di-NAC free mobile phase into the HPLC system.
Accuracy
The accuracy of an analytical method is the closeness of results obtained by that method to the true value for the placebo sample. According to ICH [50]ICH Q2 (R1), “Validation of analytical procedures: text and methodology,” in Proceedings of the International Conference on Harmonization, Geneva, Switzerland, 2005; November: 1-13.ICH Q2 (R1), “Validation of analytical procedures: text and methodology,” in Proceedings of the International Conference on Harmonization, Geneva, Switzerland, 2005; November: 1-13.ICH Q2 (R1), “Validation of analytical procedures: text and methodology,” in Proceedings of the International Conference on Harmonization, Geneva, Switzerland, 2005; November: 1-13.ICH Q2 (R1), “Validation of analytical procedures: text and methodology,” in Proceedings of the International Conference on Harmonization, Geneva, Switzerland, 2005; November: 1-13.ICH Q2 (R1), “Validation of analytical procedures: text and methodology,” in Proceedings of the International Conference on Harmonization, Geneva, Switzerland, 2005; November: 1-13.ICH Q2 (R1), “Validation of analytical procedures: text and methodology,” in Proceedings of the International Conference on Harmonization, Geneva, Switzerland, 2005; November: 1-13.ICH Q2 (R1), “Validation of analytical procedures: text and methodology,” in Proceedings of the International Conference on Harmonization, Geneva, Switzerland, 2005; November: 1-13.ICH Q2 (R1), “Validation of analytical procedures: text and methodology,” in Proceedings of the International Conference on Harmonization, Geneva, Switzerland, 2005; November: 1-13. guidelines, placebo sample with 50%, 100% and 150% of the standard NAC were analyzed. Tests to determine the accuracy were performed using solutions of low, medium and high concentrations of 0.0025 mg/ml, 0.005 mg/ml and 0.0075 mg/ml of placebo sample were prepared, each one covering the entire linearity range. The method accuracy was determined by calculating percentage (%) of recovery and relative standard deviations (RSD) was calculated for each concentration.
Precision
The precision was studied by preparing six replicates at standard level of the specification. According to ICH [50]ICH Q2 (R1), “Validation of analytical procedures: text and methodology,” in Proceedings of the International Conference on Harmonization, Geneva, Switzerland, 2005; November: 1-13.ICH Q2 (R1), “Validation of analytical procedures: text and methodology,” in Proceedings of the International Conference on Harmonization, Geneva, Switzerland, 2005; November: 1-13.ICH Q2 (R1), “Validation of analytical procedures: text and methodology,” in Proceedings of the International Conference on Harmonization, Geneva, Switzerland, 2005; November: 1-13.ICH Q2 (R1), “Validation of analytical procedures: text and methodology,” in Proceedings of the International Conference on Harmonization, Geneva, Switzerland, 2005; November: 1-13.ICH Q2 (R1), “Validation of analytical procedures: text and methodology,” in Proceedings of the International Conference on Harmonization, Geneva, Switzerland, 2005; November: 1-13.ICH Q2 (R1), “Validation of analytical procedures: text and methodology,” in Proceedings of the International Conference on Harmonization, Geneva, Switzerland, 2005; November: 1-13.ICH Q2 (R1), “Validation of analytical procedures: text and methodology,” in Proceedings of the International Conference on Harmonization, Geneva, Switzerland, 2005; November: 1-13.ICH Q2 (R1), “Validation of analytical procedures: text and methodology,” in Proceedings of the International Conference on Harmonization, Geneva, Switzerland, 2005; November: 1-13. guidelines, intraday (precision) and interday (intermediate precision) studies were carried out for assessment of the assay precision. The precision was represented by RSD. The intraday of the NAC method was checked by injecting six individual preparations of standard (0.005 mg/ml) and placebo sample (0.005 mg/ml) within the calibration range. The interday was determined by preparing standard and placebo sample at a concentration of 0.005 mg/ml on different days and on different instrument (Agilent 1100 series system, Santa Clara, CA, USA, comprised of a quaternary pump solvent delivery module). The %RSDs of intraday and interday studies was calculated for assessment of precision of the method.
Results & discussion
Method validation
The HPLC method was validated as to specificity, linearity, sensitivity, accuracy, precision (repeatability and reproducibility), LOD, LOQ, and stability as per the ICH [50]ICH Q2 (R1), “Validation of analytical procedures: text and methodology,” in Proceedings of the International Conference on Harmonization, Geneva, Switzerland, 2005; November: 1-13.ICH Q2 (R1), “Validation of analytical procedures: text and methodology,” in Proceedings of the International Conference on Harmonization, Geneva, Switzerland, 2005; November: 1-13.ICH Q2 (R1), “Validation of analytical procedures: text and methodology,” in Proceedings of the International Conference on Harmonization, Geneva, Switzerland, 2005; November: 1-13.ICH Q2 (R1), “Validation of analytical procedures: text and methodology,” in Proceedings of the International Conference on Harmonization, Geneva, Switzerland, 2005; November: 1-13.ICH Q2 (R1), “Validation of analytical procedures: text and methodology,” in Proceedings of the International Conference on Harmonization, Geneva, Switzerland, 2005; November: 1-13.ICH Q2 (R1), “Validation of analytical procedures: text and methodology,” in Proceedings of the International Conference on Harmonization, Geneva, Switzerland, 2005; November: 1-13.ICH Q2 (R1), “Validation of analytical procedures: text and methodology,” in Proceedings of the International Conference on Harmonization, Geneva, Switzerland, 2005; November: 1-13.ICH Q2 (R1), “Validation of analytical procedures: text and methodology,” in Proceedings of the International Conference on Harmonization, Geneva, Switzerland, 2005; November: 1-13. guidelines.
Robustness
The analytical method robustness was tested by evaluating the influence of minor modifications in HPLC conditions on system suitability parameters of the proposed method. The solution at the specification level was used to evaluate the robustness of the proposed method ascertained by minor changes of method conditions, such as the detection wavelength, column oven (±5 °C) temperature and flow rate (±0.1 ml/min) of the mobile phase. Equal concentration of standard and placebo sample solutions was injected separately, and the chromatograms were recorded. The content of NAC was calculated by comparing the peak area of placebo sample with that of the standard. In all modifications, good separation was achieved between NAC and placebo components, and the %RSD values of peak area obtained from repeated injections of the standard solution and assay results for analytes obtained from placebo sample solutions were all less than 2.0%. The %RSD was calculated and in all the conditions there was no significant difference from the optimum conditions. The results are as displayed in Table 1.
| Table 1 Studied robustness of placebo sample. | ||||||
| Robustness parameter | NAC standard | |||||
| Average % recovery of NAC | %RSD | USP s/n | USP tailing | USP plate count | ||
| Wavelength change (nm) | 212 | 100 | 0.4 | 1112 | 1.05 | 21763 |
| 214 | 100 | 0.2 | 612 | 1.05 | 21625 | |
| Column temperature change (oC) | 20 | 100 | 0.4 | 770 | 1.05 | 21784 |
| 25 | 100 | 0.4 | 1112 | 1.05 | 21763 | |
| 30 | 100 | 1.8 | 68 | 1.01 | 24477 | |
| Change in flow rate (ml/min) | 0.9 | 100 | 0.1 | 73 | 1.05 | 22776 |
| 1.0 | 100 | 0.4 | 1112 | 1.05 | 21763 | |
| 1.1 | 100 | 0.2 | 324 | 1.05 | 20695 | |
| Robustness parameter | Placebo sample | |||||
| Average % recovery of NAC | %RSD | USP s/n | USP tailing | USP plate count | ||
| Wavelength change (nm) | 212 | 102.20 | 0.2 | 650 | 1.05 | 21674 |
| 214 | 99.95 | 0.2 | 98 | 1.05 | 21429 | |
| Column temperature change (oC) | 20 | 102.80 | 0.2 | 276 | 1.05 | 21755 |
| 25 | 102.20 | 0.2 | 650 | 1.05 | 21674 | |
| 30 | 98.37 | 1.9 | 64 | 1.0 | 25248 | |
| Change in flow rate (ml/min) | 0.9 | 103.00 | 0.1 | 93 | 1.05 | 22671 |
| 1.0 | 102.20 | 0.2 | 650 | 1.05 | 21674 | |
| 1.1 | 102.86 | 0.4 | 100 | 1.06 | 20584 | |
| Equal concentration of NAC working standard and placebo sample solutions were injected separately, by small changing in wavelength, column temperature and flow rate. The %RSD of robustness was calculated. Experiments were performed in triplicate. NAC: N-Acetyl-L-Cysteine; RSD: Relative standard deviations; USP: United States Pharmacopoeia. | ||||||
Development & optimization of HPLC method chromatographic conditions
The stability indicating RP-HPLC analytical method for separation and quantification of NAC in placebo (DMEM, Cell treatment media) was developed and validated. Certain information about physicochemical properties and chromatographic behaviors of NAC and Di-NAC was obtained from literature studies. An appropriate combination of the column type, column temperature, mobile phase composition and flow rate, injection volume, and detection system was studied to produce a simple, fast, economic, and yet selective and accurate assay method. 20 µl injection volumes were validated as the maximum injection volume for future applications in analysis of biological samples. In determining the detection wavelength for the analytical method, different wavelengths were tested. Studied wavelength at 214 nm produced a lower NAC signal which made this approach not feasible. Hence, the detection wavelength at 212 nm was evaluated for NAC and Di-NAC and was found to produce highly sensitive peaks with enhanced resolution between NAC, Di-NAC and placebo components. The chromatography obtained at wavelength 212 nm demonstrated peaks that were reproducible, had minimal peak tailing with similar response factors, and had a high signal to noise ratio and high peak areas. The initial trial mobile phase composed of ACN and water (5:95 v/v) containing 0.1% TFA at a flow rate of 1 ml/min resulted in early elution of NAC and poor response from placebo. Consequently, the organic phase was optimized at a ratio of 4:96 (v/v) for ACN:water with 0.1% TFA resulting in increased retention time, resolution from placebo components and analysis time limited to 30 minutes. The flow rate of 1.0 ml/min was selected to sharpen the peaks, resulting in NAC and Di-NAC retention times of 8.9 min and 23.7 min, respectively. This flow rate was found to be optimal to aid in the reduction of the overall run time with an acceptable column back pressure. The column temperature was maintained at 25 °C to facilitate all the components in the sample solution were adequately separated. In this final optimized RP-HPLC method all the compounds of interest separated well in 30 minutes, followed by a re-equilibration to the initial condition. Our developed analytical method is very simple and less-expensive, having no internal standard, no ion pairing agents and derivatization, thereby providing economic benefits.
System suitability
System suitability testing was evaluated to verify that the analytical system was working as desired and can give precise and accurate results. Working standard of NAC and Di-NAC at a concentration of 0.005 mg/ml was injected five times into the HPLC system. The RSD of peak area was within 2% (Table 2), indicating the suitability of the system. Column efficiency is usually represented by the number of theoretical plates for each peak. In addition to the theoretical plates and the tailing factor is another parameter of system suitability which reflects the symmetry of the peak.
| Table 2 System suitability was determined by injecting NAC and Di-NAC standard solutions. | |||
| System suitability Parameters | NAC | Di-NAC | Acceptance criteria |
| %RSD | 0.1 | 0.5 | aNMT 2.0 |
| Theoretical plates | 21748 | 22409 | bNLT 2000 |
| Tailing factor | 1.05 | 1.0 | aNMT 2.0 |
| USP s/n | 965 | 574 | >2–3 |
| Retention time window | 8.991–8.995 | 23.729–23.746 | – |
| The %RSD for NAC and Di-NAC peak response from five replicate injections of standard solution, theoretical plate count, the tailing factor and high signal to noise were within acceptable range. Suggesting mobile phase and column efficiency are acceptable. aNMT: Not more than; bNLT: Not less than. | |||
The current method shows that all the values for the system suitability parameters are within the acceptable limits, the results are displayed in Table 2. The column efficiencies were 21748 and 22409 United States Pharmacopoeia (USP) theoretical plates for NAC and Di-NAC, respectively. The USP tailing factors were 1.05 and 1.0 for NAC and Di-NAC, respectively, indicating good column efficiency and optimum mobile phase composition.
Specificity
Specificity is the ability of the chromatographic system to chemically distinguish between sample components. To understand the placebo matrix effect, specificity was evaluated by comparing the chromatograms of mobile phase, Milli-Q® water, placebo solution, placebo sample and NAC and Di-NAC standard solutions. For this purpose, 20 μl from mobile phase, Milli-Q® water, placebo, NAC, Di-NAC standards and placebo sample solutions was injected into the HPLC system separately, and the chromatogram results are in Figure 3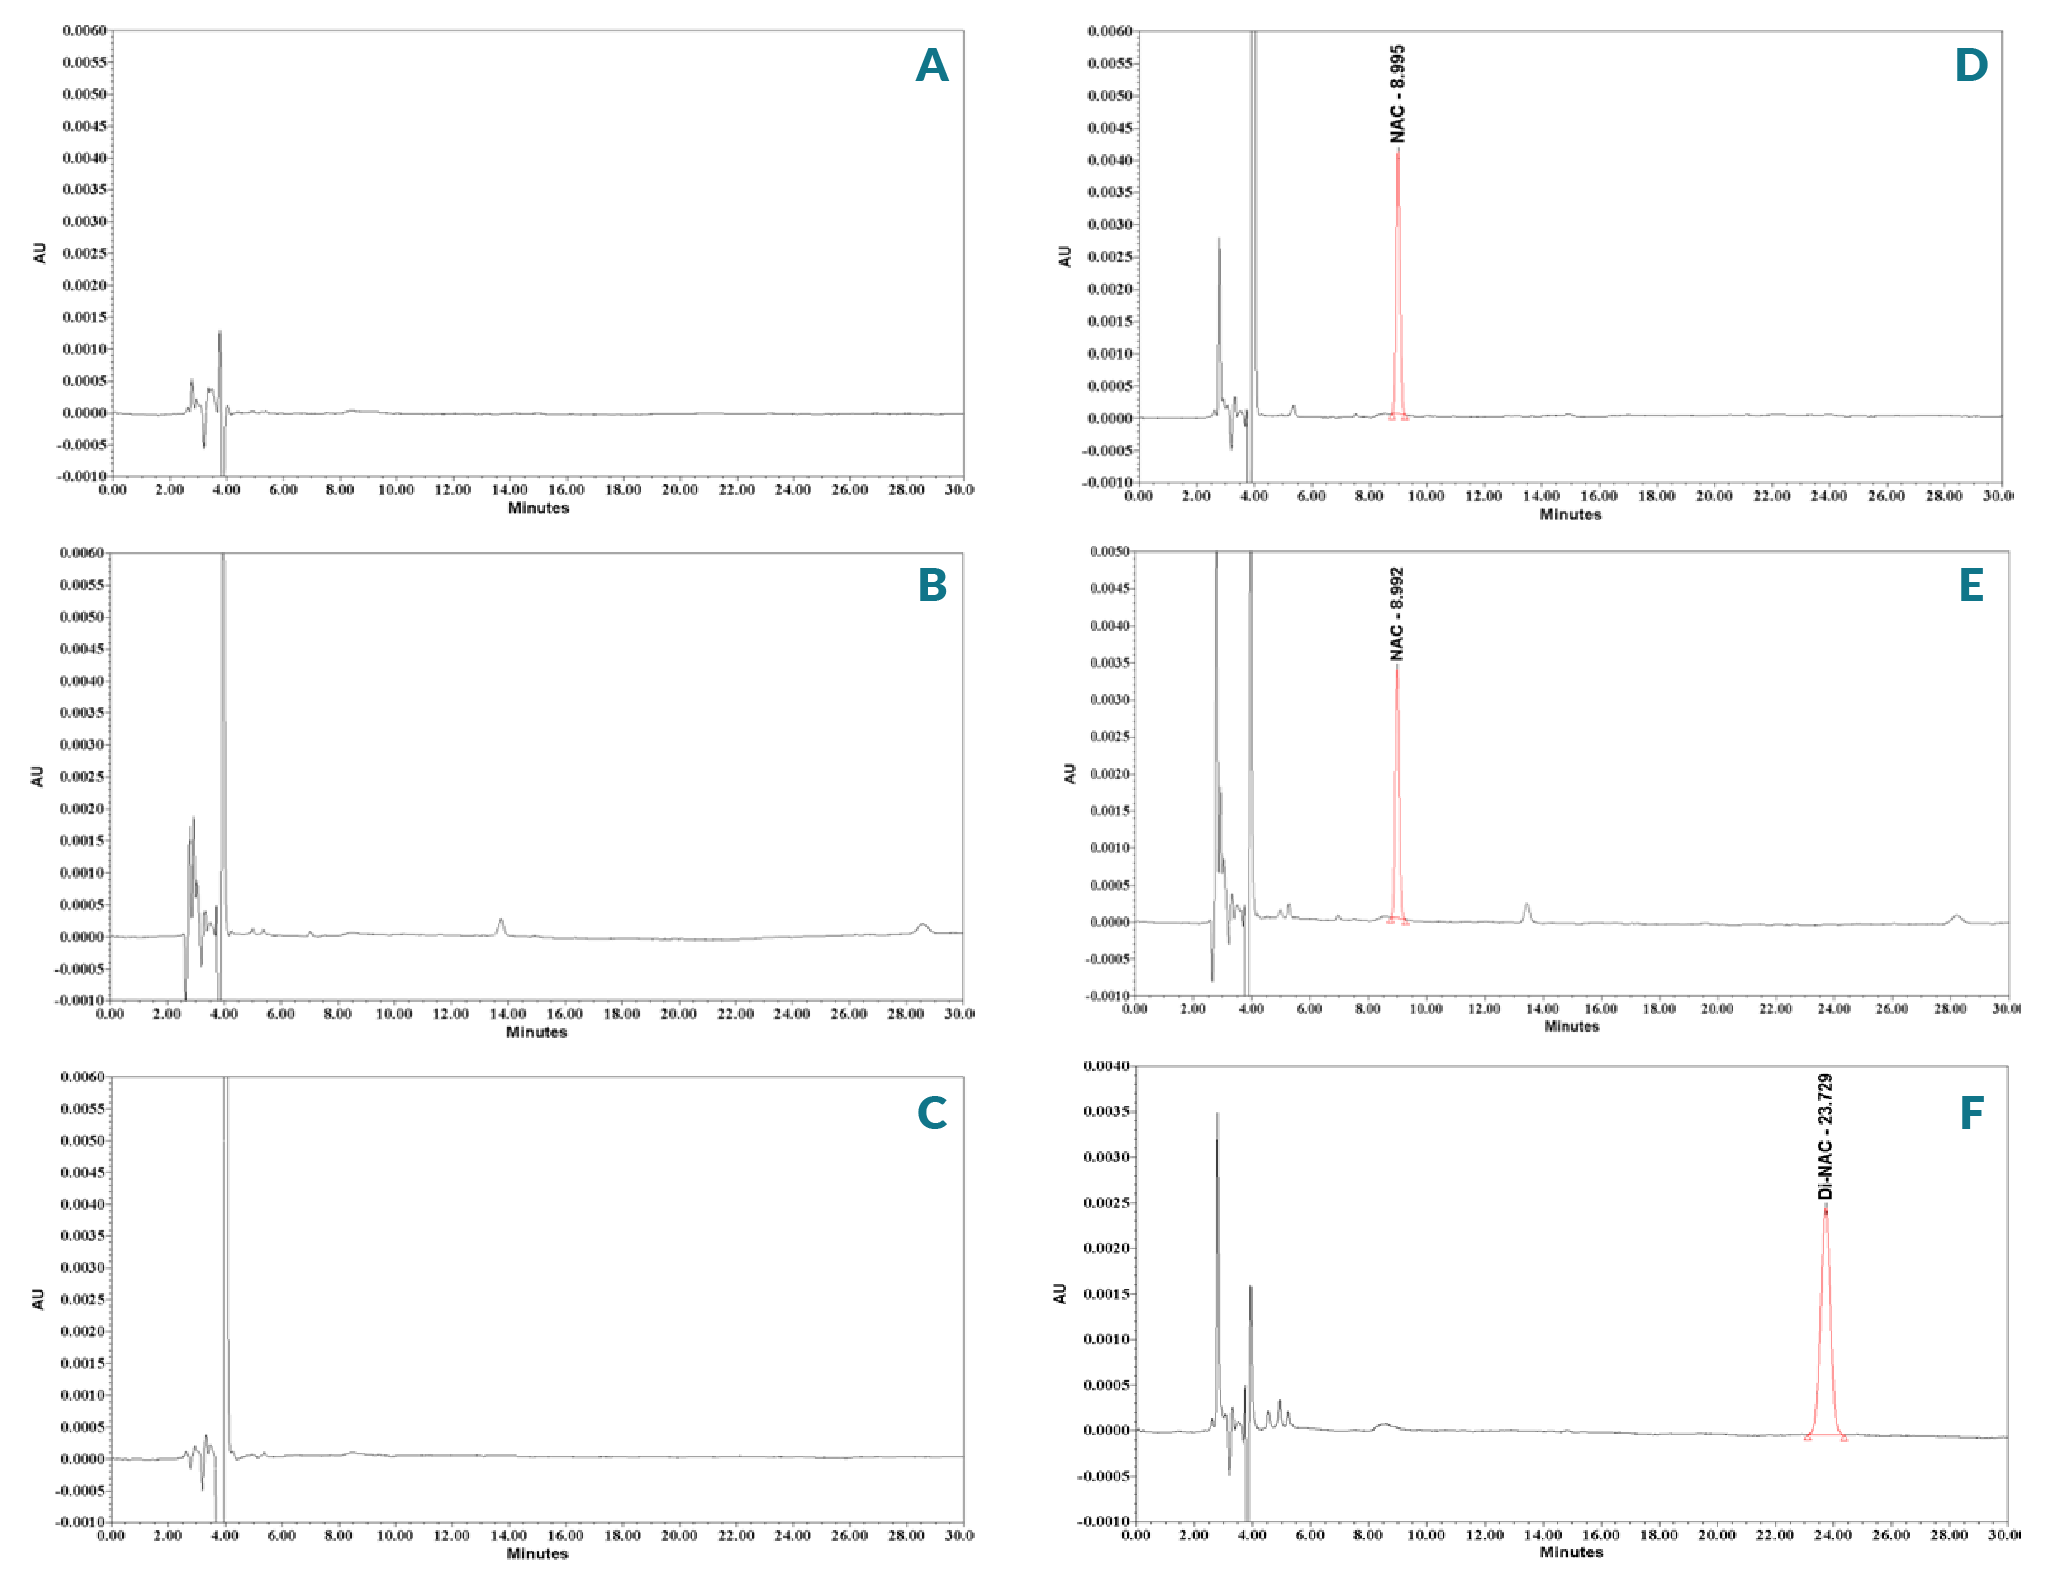
Linearity
Analytical method linearity is the ability of the method to obtain test results that are directly proportional to the analyte concentration, within a specific range. The linearity of NAC and Di-NAC was analyzed over the range of 0.0003 mg/ml to 0.01 mg/ml. The peak area obtained from the HPLC was plotted against corresponding concentrations to obtain the calibration graph. The linearity was determined by the linear regression analysis. Standard curves were constructed by plotting peak area versus concentration of the NAC and Di-NAC (Figure 4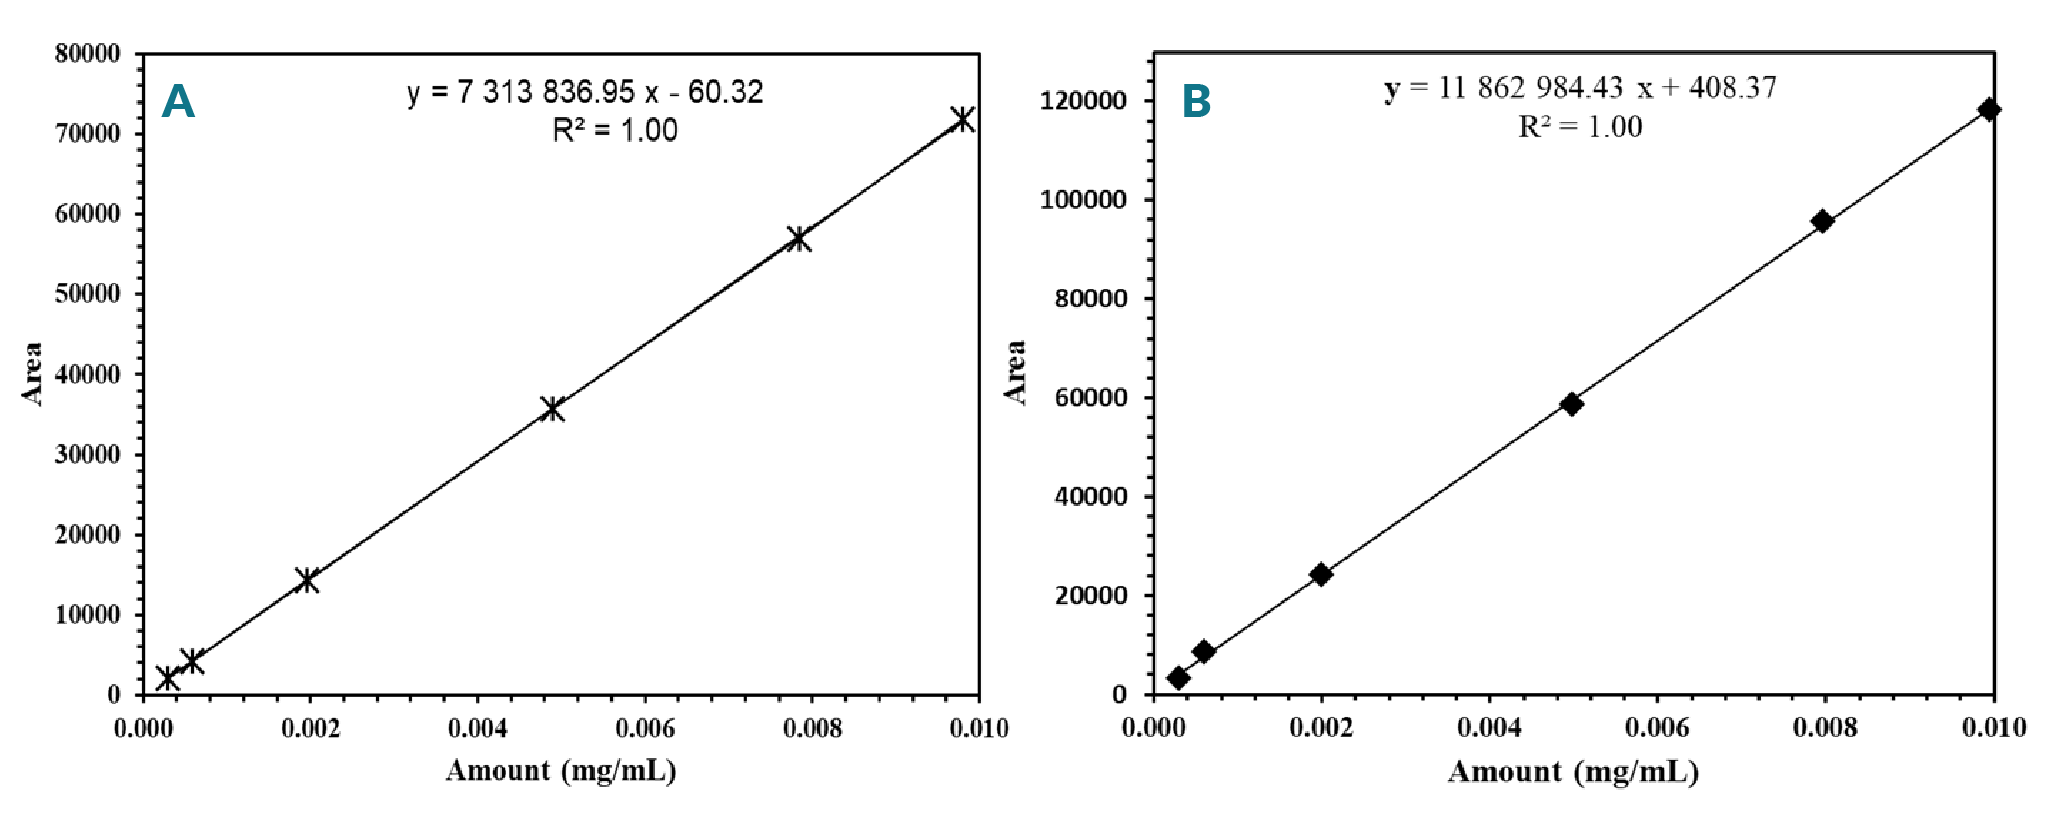
Sensitivity study
Limit of determination and limit of quantification: The LOQ is the lowest amount of the NAC and Di-NAC in the sample that can be confidently quantified using the method. The LOD of an analytical procedure is the lowest detectable amount of an analyte in a sample but not necessarily a quantifiable value. The LOD and LOQ were calculated mathematically by the relationship between the standard error (σ) of the calibration curve and its slope (S) using the multiplier according to ICH [50]ICH Q2 (R1), “Validation of analytical procedures: text and methodology,” in Proceedings of the International Conference on Harmonization, Geneva, Switzerland, 2005; November: 1-13.ICH Q2 (R1), “Validation of analytical procedures: text and methodology,” in Proceedings of the International Conference on Harmonization, Geneva, Switzerland, 2005; November: 1-13.ICH Q2 (R1), “Validation of analytical procedures: text and methodology,” in Proceedings of the International Conference on Harmonization, Geneva, Switzerland, 2005; November: 1-13.ICH Q2 (R1), “Validation of analytical procedures: text and methodology,” in Proceedings of the International Conference on Harmonization, Geneva, Switzerland, 2005; November: 1-13.ICH Q2 (R1), “Validation of analytical procedures: text and methodology,” in Proceedings of the International Conference on Harmonization, Geneva, Switzerland, 2005; November: 1-13.ICH Q2 (R1), “Validation of analytical procedures: text and methodology,” in Proceedings of the International Conference on Harmonization, Geneva, Switzerland, 2005; November: 1-13.ICH Q2 (R1), “Validation of analytical procedures: text and methodology,” in Proceedings of the International Conference on Harmonization, Geneva, Switzerland, 2005; November: 1-13.ICH Q2 (R1), “Validation of analytical procedures: text and methodology,” in Proceedings of the International Conference on Harmonization, Geneva, Switzerland, 2005; November: 1-13., [51]Analytical Procedures and Methods Validation for Drugs and Biologics: Chemistry, Manufacturing, and Controls, Federal Register (Notices). 2000; 65: 776–7. guidelines. A specific calibration curve should be studied using samples, containing an analyte in the range of LOQ. The residual standard deviation of a regression line or the standard deviation of y-intercepts of regression lines may be used as the standard deviation [49]Yedjou CG, Tchounwou CK, Haile S, Edwards F, Tchounwou PB. N-Acetyl-Cysteine Protects Against DNA Damage Associated with Lead Toxicity in HepG2 Cells. Ethn Dis. 2010; 20(1 Suppl. 1): S1–101-3.Yedjou CG, Tchounwou CK, Haile S, Edwards F, Tchounwou PB. N-Acetyl-Cysteine Protects Against DNA Damage Associated with Lead Toxicity in HepG2 Cells. Ethn Dis. 2010; 20(1 Suppl. 1): S1–101-3.Yedjou CG, Tchounwou CK, Haile S, Edwards F, Tchounwou PB. N-Acetyl-Cysteine Protects Against DNA Damage Associated with Lead Toxicity in HepG2 Cells. Ethn Dis. 2010; 20(1 Suppl. 1): S1–101-3.. For the current method, the LOD and LOQ concentration was found to be 0.0001 mg/ml and 0.00018 mg/ml for NAC and 0.00015 mg/ml and 0.00045 mg/ml for Di-NAC, respectively. The LOD and LOQ is in a comparable range or even better than other published methods. All these results imply that this analytical method is sensitive enough for determination of NAC content in cells treatment media and formulations.
Accuracy
Accuracy of the proposed method was performed on the basis of recovery studies performed by comparing the theoretical and measured concentrations of placebo samples at 50%, 100% and 150% of working the level [50]ICH Q2 (R1), “Validation of analytical procedures: text and methodology,” in Proceedings of the International Conference on Harmonization, Geneva, Switzerland, 2005; November: 1-13.ICH Q2 (R1), “Validation of analytical procedures: text and methodology,” in Proceedings of the International Conference on Harmonization, Geneva, Switzerland, 2005; November: 1-13.ICH Q2 (R1), “Validation of analytical procedures: text and methodology,” in Proceedings of the International Conference on Harmonization, Geneva, Switzerland, 2005; November: 1-13.ICH Q2 (R1), “Validation of analytical procedures: text and methodology,” in Proceedings of the International Conference on Harmonization, Geneva, Switzerland, 2005; November: 1-13.ICH Q2 (R1), “Validation of analytical procedures: text and methodology,” in Proceedings of the International Conference on Harmonization, Geneva, Switzerland, 2005; November: 1-13.ICH Q2 (R1), “Validation of analytical procedures: text and methodology,” in Proceedings of the International Conference on Harmonization, Geneva, Switzerland, 2005; November: 1-13.ICH Q2 (R1), “Validation of analytical procedures: text and methodology,” in Proceedings of the International Conference on Harmonization, Geneva, Switzerland, 2005; November: 1-13.ICH Q2 (R1), “Validation of analytical procedures: text and methodology,” in Proceedings of the International Conference on Harmonization, Geneva, Switzerland, 2005; November: 1-13.. The accuracy of an analytical method expresses the closeness of results obtained by that method to the true value. The percent accuracy was calculated at all levels. In this study, the results of recovery studies gave the average recovery rate of 102.2% (for 50% placebo samples), 103.6% (for 100% placebo samples) and 104.9% (for 150% placebo samples). The %RSD values at each level for each analyte varied from 0.0 to 0.3%, results for accuracy are summarized in . These results were within the accepted limit for recovery and a %RSD of not more than 2.0%. The tailing factor and theoretical plate count are 1.05 and 21524.
Precision
The method precision of estimation of NAC by the proposed method was evaluated by replicate analysis of six standard and placebo sample solutions each carefully prepared in quintuplicate at a concentration of 0.005 mg/ml. The precision of the method is defined as “the closeness of agreement between a series of measurements obtained from multiple sampling of the same homogeneous sample under the prescribed conditions [50]ICH Q2 (R1), “Validation of analytical procedures: text and methodology,” in Proceedings of the International Conference on Harmonization, Geneva, Switzerland, 2005; November: 1-13.ICH Q2 (R1), “Validation of analytical procedures: text and methodology,” in Proceedings of the International Conference on Harmonization, Geneva, Switzerland, 2005; November: 1-13.ICH Q2 (R1), “Validation of analytical procedures: text and methodology,” in Proceedings of the International Conference on Harmonization, Geneva, Switzerland, 2005; November: 1-13.ICH Q2 (R1), “Validation of analytical procedures: text and methodology,” in Proceedings of the International Conference on Harmonization, Geneva, Switzerland, 2005; November: 1-13.ICH Q2 (R1), “Validation of analytical procedures: text and methodology,” in Proceedings of the International Conference on Harmonization, Geneva, Switzerland, 2005; November: 1-13.ICH Q2 (R1), “Validation of analytical procedures: text and methodology,” in Proceedings of the International Conference on Harmonization, Geneva, Switzerland, 2005; November: 1-13.ICH Q2 (R1), “Validation of analytical procedures: text and methodology,” in Proceedings of the International Conference on Harmonization, Geneva, Switzerland, 2005; November: 1-13.ICH Q2 (R1), “Validation of analytical procedures: text and methodology,” in Proceedings of the International Conference on Harmonization, Geneva, Switzerland, 2005; November: 1-13., and it is normally expressed as the %RSD. The RSD of six replicate injections was calculated and assay precision was represented as the %RSD. In terms of system precision, the %RSD of retention time, peak areas, and performance of chromatographic system, represented by the tailing factor, were all less than 2.0% and the number of theoretical plates was higher than 2000 for NAC peak, results shown in Table 3. The interday was determined by preparing the standard and placebo sample at a concentration of 0.005 mg/ml on different days and on different instruments, and the RSD of six injections were calculated. In terms of method intraday, the %RSD of assay results for NAC in evaluation of repeatability and interday were all less than 2.0%, results are summarized in Table 3. Therefore, the results of both system and method precision (Table 3) showed that the method is precise within the acceptable limits (not more than 2.0% for the %RSD and the tailing factor, and not less than 2000 for the number of theoretical plates.
| Table 3 Determined intraday and interday precision of placebo sample. | ||||||||||
| # injections | NAC standard (mg/ml) | Placebo sample (mg/ml) | ||||||||
| Intraday | Peak area | NAC content | % recovery | USP tailing | USP plate count | Peak area | NAC content | % recovery | USP tailing | USP plate count |
| 1 | 36944 | 0.004964 | 100 | 1.05 | 21789 | 37320 | 0.00512 | 103.7 104 | 1.05 1.05 | 21488 |
| 2 | 36972 | 0.004964 | 100 | 1.05 | 21756 | 37631 | 0.00516 | 104.0 | 1.05 | 21548 |
| 3 | 36959 | 0.004964 | 100 | 1.05 | 21728 | 37296 | 0.00512 | 98.9 | 1.05 | 21549 |
| 4 | 37018 | 0.004964 | 100 | 1.05 | 21732 | 37272 | 0.00523 | 103.9 | 1.05 | 21515 |
| 5 | 37006 | 0.004964 | 100 | 1.05 | 21702 | 37384 | 0.00513 | 103.8 | 1.05 | 21488 |
| 6 | 36982 | 0.00496 | 100 | 1.05 | 21779 | 37262 | 0.00511 | 109.8 | 1.05 | 21566 |
| %RSD (n=6) | 0.1 | 0.4 | ||||||||
| Average NAC content | 0.004964 | 1.05 | 21748 | 0.00515 | 104.0 | 1.05 | 21526 | |||
| Interday precision | ||||||||||
| 1 | 36354 | 0.004900 | 100 | 1.0 | 22882 | 36282 | 0.00488 | 99.95 | 1.1 | 22947 |
| 2 | 36499 | 0.004900 | 100 | 1.1 | 22585 | 36533 | 0.00492 | 99.50 | 1.0 | 22481 |
| 3 | 36497 | 0.004900 | 100 | 1.1 | 22599 | 36426 | 0.00490 | 100.02 | 1.0 | 22565 |
| 4 | 36374 | 0.004900 | 100 | 1.1 | 22527 | 36629 | 0.00493 | 99.25 | 1.2 | 23259 |
| 5 | 36384 | 0.004900 | 100 | 1.0 | 22608 | 36603 | 0.00493 | 99.76 | 1.1 | 22366 |
| 6 | 36318 | 0.004900 | 100 | 1.0 | 22555 | 36347 | 0.00489 | 99.10 | 1.1 | 22777 |
| %RSD (n=6) | 0.2 | 0.4 | ||||||||
| Average NAC Content | 0.004900 | 1.1 | 22626 | 0.00490 | 99.6 | 1.1 | 22733 | |||
| To estimate the intraday precision of placebo sample, prepared six replicates of placebo sample solutions (0.005 mg/ml). The RSD of six replicate injections were calculated and assay precision was determined. The interday precision was evaluated with six replicates of placebo sample (0.005 mg/ml) solutions on different days and injected on different instrument and %RSD of six injections was calculated. The result shows that the method is precise | ||||||||||
Stability
To determine the effect of placebo components on NAC stability, the placebo sample and standard solutions for the NAC solution stability study were prepared. Stability was performed by injecting solutions of placebo samples and NAC standard. Samples were analyzed as a single batch upon the completion of the incubation study bench top stability at RT and 37 °C for 24 and 48 h. The percentage of recovery was within the range of 99.0% to 101.2% at all temperature and time points, and %RSD was 0.1% to 0.7%, results shown in Table 4, indicating a good stability of the NAC in a placebo solution for 24 and 48 h at both RT and 37 °C conditions. Figure 5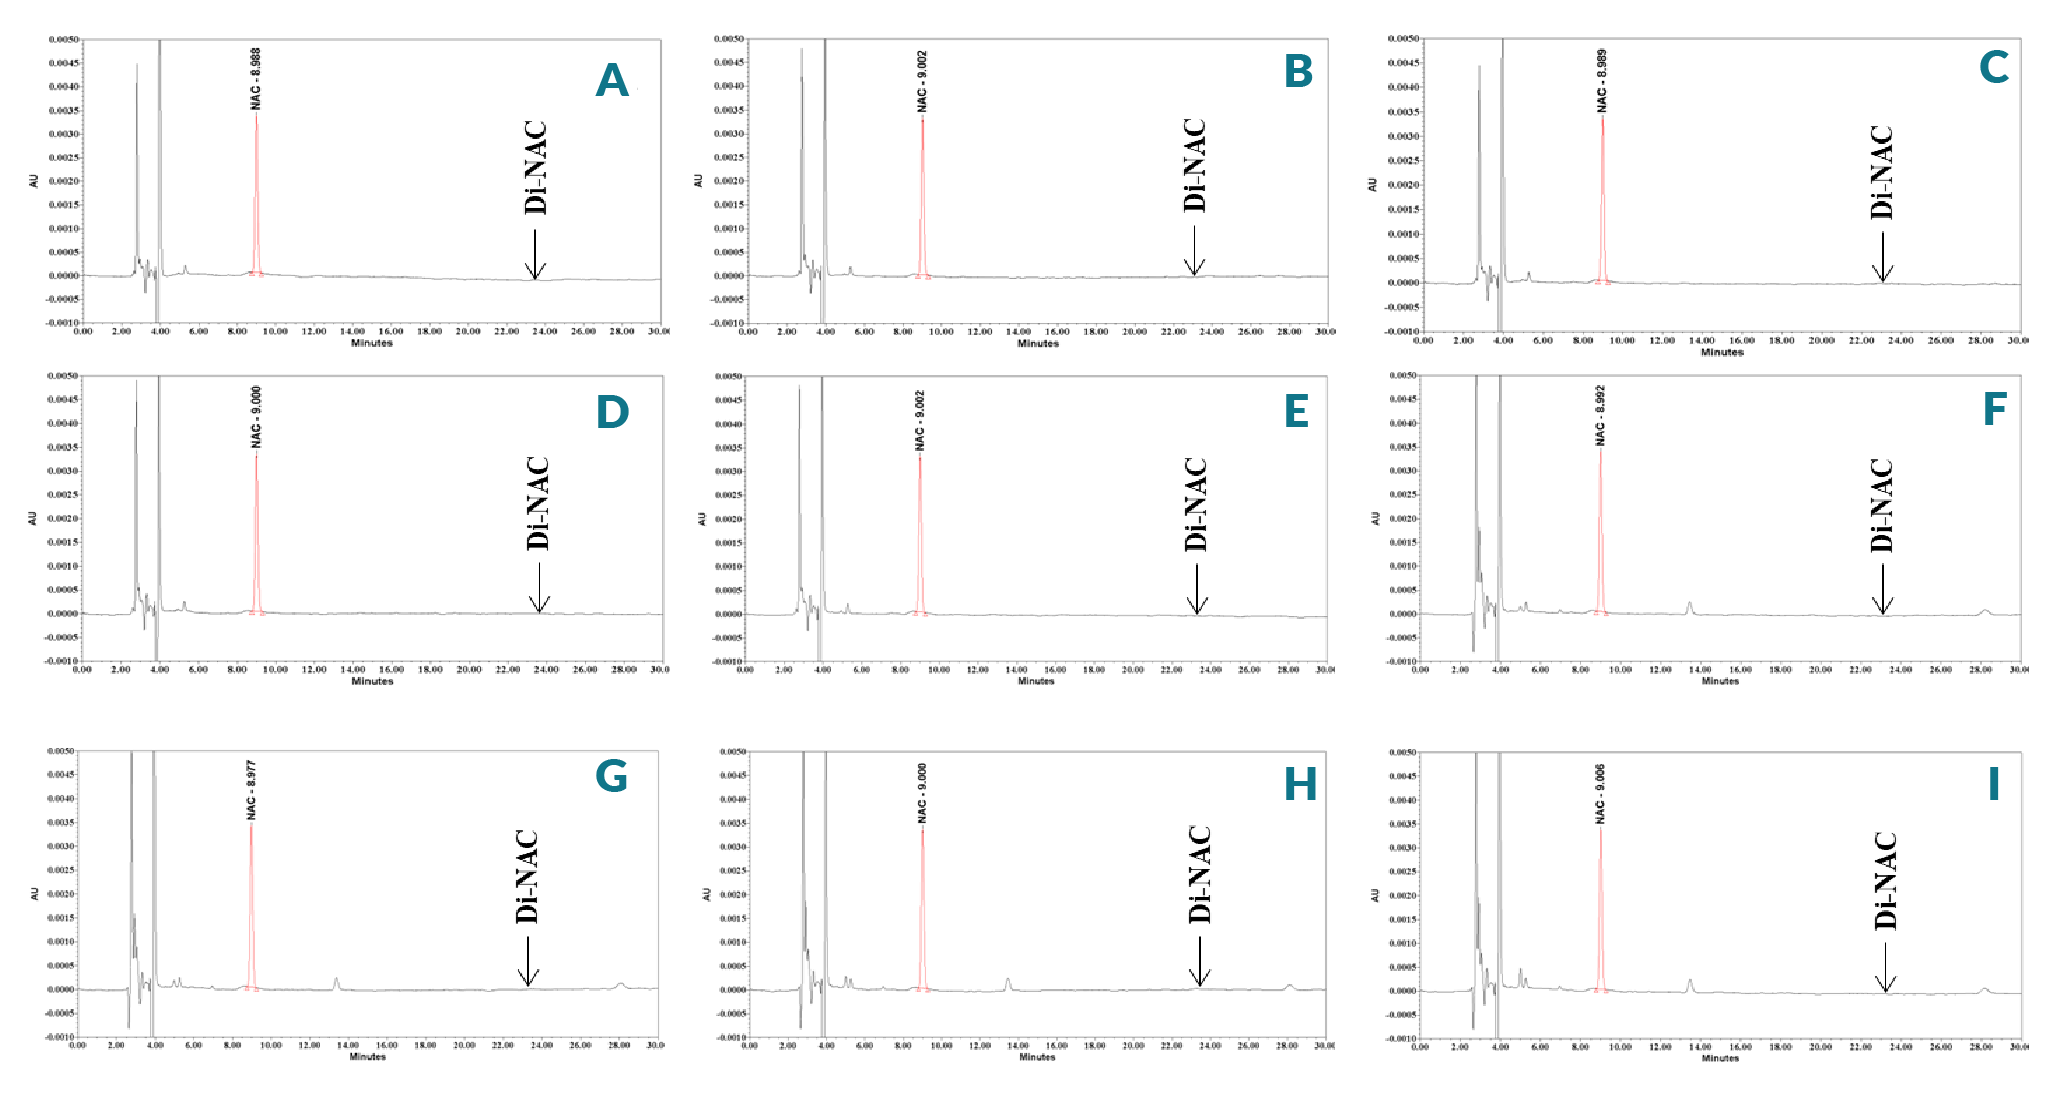
| Table 4 Studied stability of NAC in placebo. | |||||||||||||||
| Samples Stability conditions | NAC standard | Placebo sample | |||||||||||||
| % NAC recovered | %RSD | USP plate count | % NAC recovered | %RSD | % Conversion of NAC to Di-NAC | USP plate count | |||||||||
| Fresh solution | 0 h | 100.0 | 0.3 | 21776 | 103.6 | 0.0 | No | 21529 | |||||||
| Incubated at RT | 24 h | 100.2 | 0.3 | 21637 | 99.2 | 0.5 | No | 21726 | |||||||
| 48 h | 99.6 | 0.1 | 21736 | 101.2 | 0.3 | No | 21766 | ||||||||
| Incubated at 37 oC | 24 h | 99.5 | 0.7 | 21656 | 100.9 | 0.3 | No | 21679 | |||||||
| 48 h | 99.0 | 0.5 | 21704 | 100.1 | 0.6 | No | 21726 | ||||||||
| To determine the stability of NAC prepared placebo sample solution at concentration 0.005 mg/mL, solutions were incubated along with standard at RT and 37 oC for 24 and 48 h. The solutions were injected separately and the recovery of NAC was determined by comparing the peak area of the freshly prepared placebo sample and NAC standard. The stability results indicated that NAC is stable in placebo. Experiments were performed in triplicate. | |||||||||||||||
| Table 5 Studied stability of NAC in DMEM medium. | ||||||
| Solution stability condition | % of NAC content in DMEM | |||||
% Di-NAC recovered | %RSD | USP s/n | USP tailing | USP plate count | ||
Freshly prepared NAC in DMEM | 0 h | 103.7 | 0.0 | 103.6 | 1.05 | 21518 |
DMEM sample solution refrigeration at 2–8 oC | 24 h | 96.4 | 0.3 | 107 | 1.05 | 21444 |
DMEM sample solution at RT | 24 h | 84.4 | 0.2 | 92 | 1.05 | 21450 |
DMEM sample solution at 37 oC | 24 h | 78.8 | 0.2 | 80 | 1.05 | 21473 |
DMEM solution at 37 oC | 24 h | 27.8 | 0.5 | 165 | 0.90 | 22534 |
| To determine the stability of NAC in DMEM medium, NAC was dissolved in DMEM medium and immediately divided into three parts, part 1 was refrigeration at 2–8 oC, part 2 was incubated at RT (20 ± 2 oC) and part 3 was incubated at 37 oC for 24 h. After the incubation time solutions were diluted with mobile phase. The solutions were injected separately and the content of NAC was determined by comparing the peak area of the freshly prepared NAC in DMEM (further diluted with Mobile phase) and NAC standard. Experiments were performed in triplicate. | ||||||
While much work has been done to understand the impact of NAC product formulation on stability, there is limited understanding of the link between cell culture process conditions and of NAC conversion to Di-NAC during treatment. To study this, NAC solution in DMEM was prepared for the stability test. The solution was divided into three parts, and incubated at RT, 2–8 °C and 37 °C for 24 h since the analysis time did not exceed 24 h. All solutions were protected from light during incubation. All solutions were analyzed as a single batch upon completion of the incubation time against fresh Di-NAC standard solutions on the respective day, with %RSD not more than 2.0%. The average percentage of recovery of NAC was 96.4% under refrigerated condition, 84.4% under RT and 78.8% under 37 °C conditions. The results are summarized in Table 5 and indicate NAC was not stable in DMEM in all three temperature conditions. Amongst the three different temperature conditions the oxidation is rapid at both RT and 37 °C and slow under refrigerated temperature. The major oxidation product of the NAC at higher temperature is Di-NAC. As depicted in Figure 6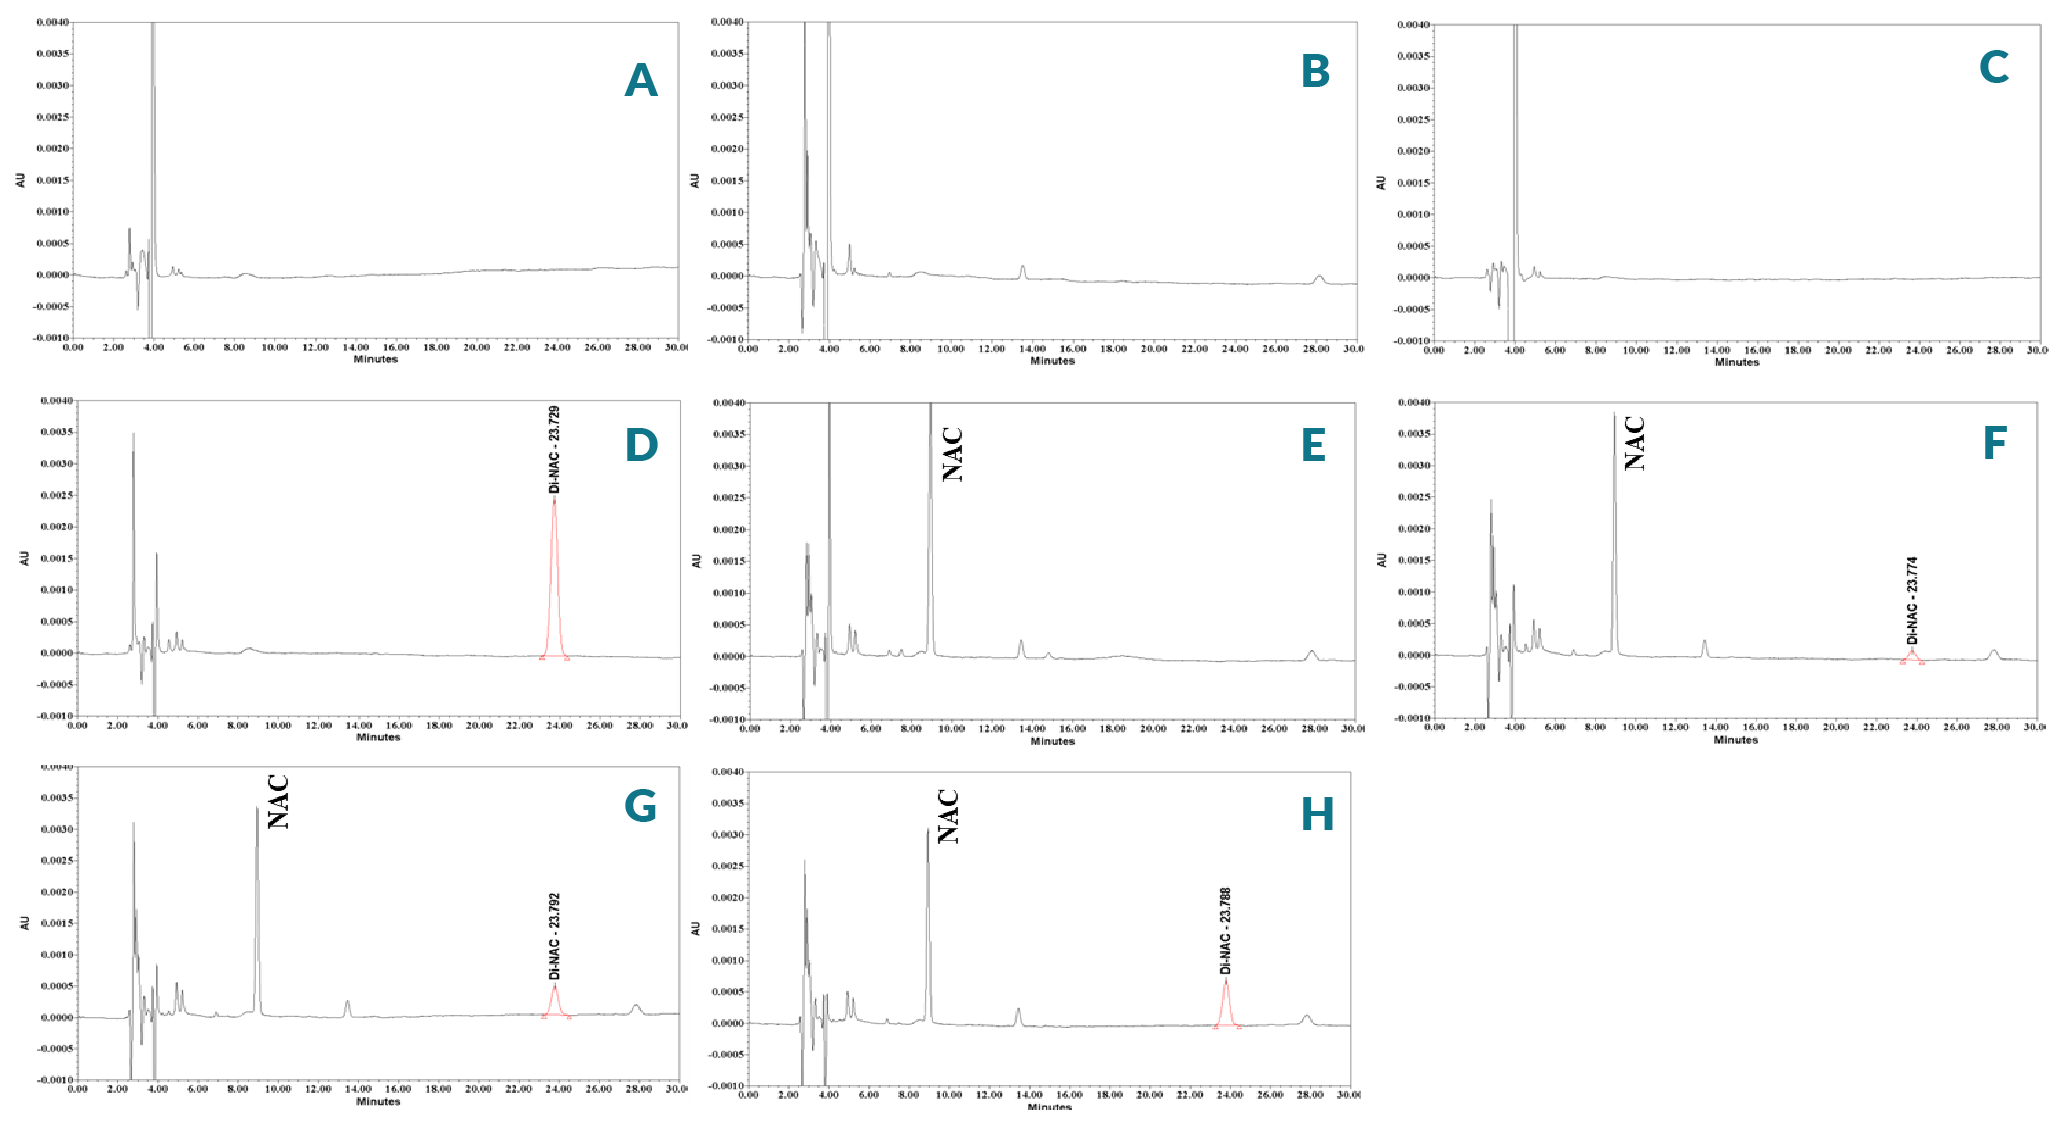
| Table 6 Determined Di-NAC content in DMEM after incubated at different temperatures. | ||||||
| NAC solution stability condition | % Di-NAC recovered | % of Di-NAC in DMEM | ||||
| %RSD | USP s/n | USP tailing | USP plate count | |||
| Standard Di-NAC | Fresh | 100 | 0.5 | 574 | 0.99 | 22408 |
| Fresh DMEM solution | 0 h | 0.0 | 0.0 | – | – | – |
| DMEM solution refrigeration at 2–8 oC | 24 h | 5.2 | 1.3 | 31 | 0.99 | 22982 |
| DMEM solution at RT | 24 h | 18.2 | 0.0 | 98 | 1.02 | 22237 |
| DMEM solution at 37 oC | 24 h | 27.8 | 0.5 | 165 | 0.90 | 22534 |
| To determine the stability of NAC in DMEM, NAC was dissolved in DMEM and immediately divided into three parts, part 1 was refrigeration at 2–8 oC, part 2 was incubated at RT and part 3 was incubated at 37 oC for 24 h. The solutions were injected separately and the content of Di-NAC was determined by comparing the peak area of the freshly prepared NAC in DMEM (diluted with mobile phase) and Di-NAC standard. Experiments were performed in triplicate. | ||||||
Discussion
NAC is considered by the World Health Organization (WHO) as a relevant medication needed in a basic health system [52]World Health Organization Model List of Essential Medicines, 21st List, 2019 [database on the Internet]. World Health Organization. 2019.. NAC is safe, even in large doses [10]Bavarsad Shahripour R, Harrigan MR, Alexandrov AV. N-acetylcysteine (NAC) in neurological disorders: mechanisms of action and therapeutic opportunities. Brain Behavior 2014; 4(2): 108–22.Bavarsad Shahripour R, Harrigan MR, Alexandrov AV. N-acetylcysteine (NAC) in neurological disorders: mechanisms of action and therapeutic opportunities. Brain Behavior 2014; 4(2): 108–22., and is a better source of Cys than Cys itself. However, optimum drug delivery is the key to successful treatment. Quantitative determination of NAC is one of the most important studies for the pharmaceutical industry because of the direct effect of active ingredients on human health. A sensitive and accurate analytical method allows the scientist to perform quantitative determination at trace levels without the interference effect. The main objective of method development was to determine the stability-indicating NAC in the presence of structurally similar Di-NAC and related substances in cell culture media within a reasonable run time. The RP-HPLC method was developed to select chromatographic conditions (stationary phase, mobile phase, wavelength for recording chromatogram of UV-Vis detector) and sample preparation procedure. For this purpose, preliminary trials were performed by varying the composition of mobile phase and optimizing chromatographic conditions on a C18 column. A series of trial runs were executed using different mobile phase and chromatographic conditions.
Preliminary studies involved trying different C18 columns and different mobile phase compositions for the effective separation of NAC. For optimum separation of the NAC, Di-NAC and placebo components, C18 column was chosen as the stationary phase. For selecting the wavelength for NAC, different wavelengths were studied and an absorption maximum was found at 212 nm. The mobile phase composition was developed based on the pKa of NAC. Literature was searched for mobile phase organic solvents and Acetonitrile is well known to have a higher elution capacity than methanol [53]Kundukad B, Schussman M, Yang K et al. Mechanistic action of weak acid drugs on biofilms. Sci. Rep. 2017; 7(1).. NAC was chromatographed with different mobile phases, consists 4:96 (v/v) ACN:water with 0.1% Orthophosphoric acid (OPA) and 4:96 (v/v) ACN:water with 0.1% TFA, and no significant differences between the two mobile phases, regarding the separation of both NAC and Di-NAC was found. OPA has pKa values 2.14, 6.86, and 12.4 [54]Hastings AB, Murray CD, Sendroy J. Studies of the solubility of calcium salts. II. The Solubility of Tertiary Calcium Phosphate in Salt Solutions and Biological Fluids. J. Biol. Chem. 1927; 71(3): 783–96. Since mobile phase containing 0.1% OPA has a higher pH than the pKa of the NAC carboxylic group and placebo components, there are insufficient protons (H+) in solution, and NAC dissociates into its conjugate base and become ionized, resulting in reduced retention, on RP-HPLC. Moreover, found placebo components peaks were interfering and co-eluted with the NAC peak (Data not shown).
NAC, its impurities, and thiol containing placebo components, are highly polar in nature. And for their maximum retention a column with a greater non-polarity is required [55]Dolan JW. Retaining Polar Compounds; LC trouble shooting. California: LC Resources Inc., Walnut Creek, California, USA, 2001; 2–4.. Consequently, the placebo components, Cys, L-Cystine and other impurities elute near the void volume. For retaining such compounds on non-polar stationary phase mobile phase modifiers like, ion pair reagents need to be used. The pH of the mobile phase is usually a key parameter for selectivity optimization when dealing with analyte molecules that have ionizable groups. Changes in mobile phase pH should be undertaken carefully as not all silica based HPLC columns are resistant to extremes of pH. As per Henderson- Hesselbach [56]Henderson LJ. Concerning the relationship between the strength of acids and their capacity to preserve neutrality. Am. J. Physiol.-Legacy Content 1908; 21(2): 173–9., [57]Hasselbalch KA. Die Berechnung der Wasserstoffzahl des Blutes aus der freien und gebundenen Kohlensäure desselben, und die Sauerstoffbindung des Blutes als Funktion der Wasserstoffzahl. Berlin: Biochemische Zeitschrift. 1917; 78: 112–144. equation, molecules above their acid groups pKa are known to exist in their ionized form and elute early from the column. According to physicochemical studies, the pKa of NAC carboxylic acid is 3–3.5 and -SH group is 9–9.5 [58]Noszál B, Visky D, Kraszni M. Population, Acid−Base, and Redox Properties of N-Acetylcysteine Conformers. J. Med. Chem. 2000; 43(11): 2176–82.. To further increase retention of NAC, reduce the run time and maintain selectivity among structurally similar Di-NAC and placebo components, the mobile phase was optimized to a ratio of 4:96 (v/v) ACN:water with 0.1% TFA. A solution of 0.1% TFA gives a pH of approximately 1.8–2.0 in aqueous solutions [59]Snyder LR, Kirkland JJ, Glajch JL. Practical HPLC Method Development, Second Edition. Wiley-Interscience, New York, 1997.Snyder LR, Kirkland JJ, Glajch JL. Practical HPLC Method Development, Second Edition. Wiley-Interscience, New York, 1997.. Therefore, at this concentration, the mobile phase pH is less than the pKa of NAC carboxylic acid groups, and NAC and Di-NAC remains in the unionized form. Although the silane groups of the C18 column are also fully protonated the acidic environment provides sufficient protons (H+) in the solution that the acidic NAC will retain its protons, improving retention on RP-HPLC. In addition, the NAC and Di-NAC amino groups are acetylated and the non-polar part binds to the non-polar chain on the column further increasing their retention [59]Snyder LR, Kirkland JJ, Glajch JL. Practical HPLC Method Development, Second Edition. Wiley-Interscience, New York, 1997.Snyder LR, Kirkland JJ, Glajch JL. Practical HPLC Method Development, Second Edition. Wiley-Interscience, New York, 1997..
As the NAC samples of interest were from a DMEM solution, it was important that the matrices present (amino acids, water soluble vitamins, sodium pyruvate, HEPES, glucose, minerals, sodium carbonate, sodium bicarbonate, salts, etc.) in those samples did not interfere with the NAC quantitation. TFA was used to provide a good peak shape and avoid the use of buffer salts that may precipitate due to innumerable interactions with placebo components. Selectivity studies were carried out to confirm that the developed RP-HPLC method had the capability to generate “true results” i.e., those tests are free from matrix interference. The HPLC chromatograms in Figure 3A–C indicate that there was no peak around the NAC and Di-NAC retention time in any of the experimental media: (i) placebo without NAC and Di-NAC, (ii) Mobile Phase and (iii) Milli-Q® water. In addition, eliminating a buffer allows the method to be easily adapted for other complex samples analysis of NAC in the future. Column temperature was maintained at 25 °C. An isocratic mobile phase was used because of its stable baseline and unvarying response factor in method development assays. Different flow rates were tested; increasing flow rate decreases retention times, but also led to interference of placebo components. A 1.0 ml/min flow rate was found to be optimal, and led to an optimal run time of 30 minutes. An injection volume of 20 µl was adequate to analyze NAC, Di-NAC and placebo components.
Stability studies provide knowledge on the possible oxidation of NAC during cell’s treatment and its oxidized product Di-NAC in supplement media. NAC undergoes various transformations to form its known and unknown impurities in different stress conditions. The main impurity in NAC is Di-NAC which is formed in all the stress conditions due to the high susceptibility of the thiol moiety to oxidize and form disulphide (Figure 1). As a thiol-containing compound, NAC is readily oxidized to disulfide dimer Di-NAC [60]Hamlow EE, Peck GE. The Stability of Solutions of Acetylcysteine to Oxidation During Nebulization. Anesthesiology 1967; 28(5): 934–5. at 25 °C [61]Lee T-Y, Chen C-M, Lee C-N, Chiang Y-C, Chen H-Y. Compatibility and osmolality of inhaled N-acetylcysteine nebulizing solution with fenoterol and ipratropium. Am. J. Health-System Pharm. 2005; 62(8): 828–33.. This impurity is also seen to form during treatment and storage of NAC. The amount of NAC was found to be in the range of 99.2% to 101.2% of theoretical at room temperature and 37 °C conditions of standard and placebo sample, thus proving the stability power of the method. The stability result of standard and placebo sample solutions showed that there is no instability up to 48 hours at both temperatures. No additional peaks were observed at any of the time points in comparison to zero day analysis (Figure 5). This leads us, to conclude that the standard and placebo sample in acidic solutions were stable at both temperatures. Our results suggests that the chemical stability of NAC, the active pharmaceutical ingredient, is well within the guidelines set forth in United States Pharmacopeia Chapter <795> (90% to 110% stated potency) for both temperatures (Table 4).
Stability testing indicated that the known impurity Di-NAC is on oxidation impurity which needs to be strictly monitored during stability studies. The purpose of this study was to determine the 24 h stability of NAC in DMEM when incubated in a temperature which may mimic a treatment of cell’s conditions. To investigate, different temperature (RT, 2–8 °C and 37 °C) conditions were incubated for 24 h to simulate any possible oxidation that might occur during media preparation and in vitro or ex vivo experiments. All solutions were protected from light during the stability period. Samples were subsequently analyzed against fresh standard solutions using the RP-HPLC method. The results showed that NAC was subjected to oxidation (Table 5 & Figure 6) and was susceptible to conversion of NAC to Di-NAC in DMEM in all temperature conditions. The NAC sulfur atom can adopt a variety of oxidation states, for example, the NAC thiol group can behave as a potent nucleophile or reducing agent, while its corresponding disulfide might behave as an electrophile or oxidizing agent. The specific reactivity of each NAC thiol is governed by its micro and macro-environment in the solution, with its pKa and redox potential influenced by the local polarity and interactions with neighboring residues.
Conclusion
In the present work, a new sensitive and reproducible stability indicating RP-HPLC method was established for the quantitative analysis of NAC in DMEM, to support quality control and to assure the therapeutic efficacy of the NAC. In addition, another difference and advantage of our study is that the method of analysis has been tested in DMEM which is the transport media where permeability studies were carried out in cell culture methods. The method has been successfully validated as per ICH guidelines for specificity, linearity, accuracy, and precision, limit of quantitation and limit of detection, and proved to be suitable for routine quality control use. The results demonstrate that the method is suitable for evaluating the stability of NAC in cell treatment medium, pharmaceutical formulations and biological matrices products.
Supplementary Data
Download supplementary data here.
References
1. Prescott LF. New approaches in managing drug overdosage and poisoning. BMJ 1983; 287(6387): 274–6. Crossref
2. Otu A, Langridge P, Denning D. Nebulised N-Acetylcysteine for Unresponsive Bronchial Obstruction in Allergic Brochopulmonary Aspergillosis: A Case Series and Review of the Literature. J. Fungi 2018; 4(4): 117. Authorship & Conflict of Interest Crossref
3. Nigwekar SU, Kandula P. N-Acetylcysteine in Cardiovascular-Surgery–Associated Renal Failure: A Meta-Analysis. Ann. Thor. Surg. 2009; 87(1): 139-47. Crossref
4. Huang R, Pan Q, Ma X et al. Hepatic Stellate Cell-Derived Microvesicles Prevent Hepatocytes from Injury Induced by APAP/H2O2. Stem Cells Int. 2016; 1–12. Crossref
5. Penugonda S, Mare S, Goldstein G, Banks WA, Ercal N. Effects of N-acetylcysteine amide (NACA), a novel thiol antioxidant against glutamate-induced cytotoxicity in neuronal cell line PC12. Brain Res. 2005; 1056(2): 132–8. Crossref
6. Sarnstrand B, Jansson AH, Matuseviciene G, Scheynius A, Pierrou S, Bergstrand H. N,N’-Diacetyl-L-cystine-the disulfide dimer of N-acetylcysteine-is a potent modulator of contact sensitivity/delayed type hypersensitivity reactions in rodents. J. Pharmacol. Exp. Ther. 1999; 288(3): 1174–84. Crossref
7. Rehman SU, Vacek T, Ali A et al. Genes Or Dose, East Or West What Makes N Acetyl Cysteine Work? Meta-Analysis Of Nac Low Dose Vs High Dose Comparing Trials Done In Asian Population Vs European Population. American Journal of Respiratory and Critical Care Medicine; New York, 2016; 193: 1. Crossref
8. National Center for Biotechnology Information. PubChem Database. Acetylcysteine, CID=12035: https://pubchem.ncbi.nlm.nih.gov/compound/Acetylcysteine Crossref
9. Sen CK. Nutritional biochemistry of cellular glutathione. J. Nutr. Biochem. 1997; 8(12): 660–72. Crossref
10. Bavarsad Shahripour R, Harrigan MR, Alexandrov AV. N-acetylcysteine (NAC) in neurological disorders: mechanisms of action and therapeutic opportunities. Brain Behavior 2014; 4(2): 108–22. Crossref
11. Uttamsingh V, Keller DA, Anders MW. Acylase I-Catalyzed Deacetylation of N-Acetyl-l-cysteine and S-Alkyl-N-acetyl-l-cysteines. Chem. Res. Toxicol. 1998; 11(7): 800-9. Crossref
12. White CC, Viernes H, Krejsa CM, Botta D, Kavanagh TJ. Fluorescence-based microtiter plate assay for glutamate–cysteine ligase activity. Anal. Biochem. 2003; 318(2): 175–80. Crossref
13. Ottenwolder H, Simon P. Differential effect of N-acetylcysteine on excretion of the metals Hg, Cd, Pb and Au. Arch. Toxicol. 1987; 60(5): 401–2. Crossref
14. Wu G, Fang Y-Z, Yang S, Lupton JR, Turner ND. Glutathione Metabolism and Its Implications for Health. J. Nutr. 2004; 134(3):489–92. Crossref
15. Raffaele M, Barbagallo I, Licari M et al. N-Acetylcysteine (NAC) Ameliorates Lipid-Related Metabolic Dysfunction in Bone Marrow Stromal Cells-Derived Adipocytes. Evid. Based Complement. Alt. Med. 2018; 1–9. Crossref
16. Kerksick C, Willoughby D. The Antioxidant Role of Glutathione and N-Acetyl-Cysteine Supplements and Exercise-Induced Oxidative Stress. J. Int. Soc. Sports Nutr. 2005; 2(2). Crossref
17. Zafarullah M, Li WQ, Sylvester J, Ahmad M. Molecular mechanisms of N -acetylcysteine actions. Cell. Mol. Life Sci. 2003; 60(1): 6–20. Crossref
18. Aruoma OI, Halliwell B, Hoey BM, Butler J. The antioxidant action of N-acetylcysteine: Its reaction with hydrogen peroxide, hydroxyl radical, superoxide, and hypochlorous acid. Free Radic. Biol. Med. 1989; 6(6): 593–7. Crossref
19. Benrahmoune M, Thérond P, Abedinzadeh Z. The reaction of superoxide radical with N-acetylcysteine. Free Radic. Biol. Med. 2000; 29(8): 775–82. Crossref
20. Tardiolo G, Bramanti P, Mazzon E. Overview on the Effects of N-Acetylcysteine in Neurodegenerative Diseases. Molecules 2018; 23(12): 3305. Crossref
21. Al-Ghannam SM, El-Brashy AM, Al-Farhan BS. Fluorimetric determination of some thiol compounds in their dosage forms. Il Farmaco. 2002; 57(8): 625–9. Crossref
22. Mitsopoulos P, Suntres ZE. Protective Effects of Liposomal N-Acetylcysteine against Paraquat-Induced Cytotoxicity and Gene Expression. J. Toxicol. 2011; 1–14. Crossref
23. Ellis AG, Ching MS, Shilson AD, Kong DCM, Garrett K. Stability of a Formulated N‐acetylcysteine Capsule for Prevention of Contrast‐Induced Nephropathy. J. Pharm. Pract. Res. 2015. Crossref
24. Bartolomeo MP, Maisano F. Validation of a reversed-phase HPLC method for quantitative amino acid analysis. J. Biomol. Tech. 2006; 17(2): 131–7. Crossref
25. Wu W, Goldstein G, Adams C, Matthews RH, Ercal N. Separation and quantification ofN-acetyl-l-cysteine andN-acetyl-cysteine-amide by HPLC with fluorescence detection. Biomed. Chromatograph. 2006; 20(5): 415–22. Crossref
26. Martinović A, Radić N. Kinetic Potentiometric Determination of some Thiols with Iodide Ion‐Sensitive Electrode. Anal. Lett. 2007; 40(15): 2851–9. Crossref
27. Alvarez-Coque MCG, Hernández MJM, Camañas RMV, Fernández CM. Spectrophotometric determination of N-acetylcysteine in drug formulations with o-phthalaldehyde and isoleucine. The Analyst 1989; 114(8): 975–7. Crossref
28. Kukoc-Modun L, Radic N. Kinetic Spectrophotometric Determination of N-Acetyl-L-cysteine Based on a Coupled Redox-Complexation Reaction. Anal. Sci. 2010; 26(4): 491–5. Crossref
29. Raggi MA, Cavrini V, Di Pietra AM. Colorimetric Determination of Acetylcysteine, Penicillamine, and Mercaptopropionylglycine in Pharmaceutical Dosage Forms. J. Pharmaceut. Sci. 1982; 71(12): 1384–6. Crossref
30. Ogwu V, Cohen G. A Simple Colorimetric Method for the Simultaneous Determination of N-Acetylcysteine and Cysteine. Free Radic. Biol. Med. 1998; 25(3): 362–4. Crossref
31. Li H, Du J. Sensitive Chemiluminescence Determination of Three Thiol Compounds Based on Cu(II)-Catalyzing Luminol Reaction in the Absence of an Oxidant. Anal. Lett. 2009; 42(13): 2131–40. Crossref
32. Shaidarova LG, Gedmina AV, Zhaldak ER, Chelnokova IA, Budnikov GK. Voltammetric Determination of Acetylcysteine in Drugs Using an Electrode Modified by an Osmium Hexacyanocobaltate Film. Pharmaceut. Chem. J. 2014; 47(12): 670–4. Crossref
33. Silva ISd, Araújo MFA, Ferreira HA et al. Quantification of N-acetylcysteine in pharmaceuticals using cobalt phthalocyanine modified graphite electrodes. Talanta 2011; 83(5): 1701–6. Crossref
34. Santos VBd, Guerreiro TB, Suarez WT, Faria RC, Fatibello-Filho O. Evaluation of turbidimetric and nephelometric techniques for analytical determination of n-acetylcysteine and thiamine in pharmaceutical formulations employing a lab-made portable microcontrolled turbidimeter and nephelometer. J. Brazil. Chem. Soc. 2011; 22(10): 1968–78. Crossref
35. Lu C, Liu G, Jia J et al. Liquid chromatography tandem mass spectrometry method for determination of N-acetylcysteine in human plasma using an isotope-labeled internal standard. Biomed. Chromatography 2011; 25(4): 427–31. Crossref
36. Longo A, Di Toro M, Galimberti C, Carenzi A. Determination of N-acetylcysteine in human plasma by gas chromatography—mass spectrometry. J. Chromatography B 1991; 562(1–2): 639–45. Crossref
37. Dette C, Wätzig H. Separation of enantiomers of N-acetylcysteine by capillary electrophoresis after derivatization byo-phthaldialdehyde. Electrophoresis 1994; 15(1): 763–8. Crossref
38. Jaworska M, Szulińska G, Wilk M, Tautt J. Capillary electrophoretic separation of N-acetylcysteine and its impurities as a method for quality control of pharmaceuticals. J. Chromatography A 1999; 853(1–2): 479–85. Crossref
39. Chanduluru Hemanth Kumar GU, Santha Arcot. Method development and validation for simultaneous assessment of clomiphene citrate and n-acetyl cysteinein mixed tablet dosage form by RP-UPLC. WJPPS 2014; 3(3): 1773–80 Crossref
40. Jyothi N, Pasha S. Development and Validation of a New Rp-Hplc Method For Simultaneous Estimation of N-Acetylcysteine and L – Arginine in Combined Dosage form. Orient. J. Chem. 2014; 30(3): 1371–8. Crossref
41. Dabir J, Mathew EM, Moorkoth S. Analytical Method Development and Validation of RP-HPLC Method for Simultaneous Estimation of N-acetyl cysteine and Cefexime from its Fixed Dose Combination. Res. J. Pharm. Technol. 2016; 9(7): 835. Crossref
42. The European Directorate for the Quality of Medicines and HealthCare, European Pharmacopoeia, and British Pharmacopoeia. Pharmaceutical Medicine: Oxford University Press; 2013; 34–6. Crossref
43. Jaworska M, Szulińska G, Wilk M, Tautt J. Capillary electrophoretic separation of N-acetylcysteine and its impurities as a method for quality control of pharmaceuticals. J. Chromatography A 1999; 853(1): 479–85. Crossref
44. Toussaint B, Pitti C, Streel B, Ceccato A, Hubert P, Crommen J. Quantitative analysis of N-acetylcysteine and its pharmacopeial impurities in a pharmaceutical formulation by liquid chromatography–UV detection–mass spectrometry. J. Chromatography A 2000; 896(1–2): 191–9. Crossref
45. Kinjawadekar V, Boddu S, Ghadge O. A novel stability indicating rp-hplc method for the simultaneous estimation of n-acetylcysteine and ambroxol in combined tablet dosage form. IJPSR 2017; 8(8): 2161–7. Crossref
46. Sana S, Rajani A, Sumedha N, Pravin P, Shripad N. Development and Validation of RP-HPLC Method for the Estimation of NAcetylcysteine in Wet Cough Syrup. Int. J. Drug Dev. Res. 2012; 4(2): 284–93. Crossref
47. Ercal N, Oztezcan S, Hammond TC, Matthews RH, Spitz DR. High-performance liquid chromatography assay for N-acetylcysteine in biological samples following derivatization with N-(1-pyrenyl)maleimide. J. Chromatography B 1996; 685(2): 329–34. Crossref
48. Johansson M, Lenngren S. Determination of cysteine, glutathione and N-acetylcysteine in plasma by ion-pair reversed-phase liquid chromatography and post-column derivatization. J. Chromatography B 1988; 432: 65–74. Crossref
49. Yedjou CG, Tchounwou CK, Haile S, Edwards F, Tchounwou PB. N-Acetyl-Cysteine Protects Against DNA Damage Associated with Lead Toxicity in HepG2 Cells. Ethn Dis. 2010; 20(1 Suppl. 1): S1–101-3. Crossref
50. ICH Q2 (R1), “Validation of analytical procedures: text and methodology,” in Proceedings of the International Conference on Harmonization, Geneva, Switzerland, 2005; November: 1-13. Crossref
51. Analytical Procedures and Methods Validation for Drugs and Biologics: Chemistry, Manufacturing, and Controls, Federal Register (Notices). 2000; 65: 776–7. Crossref
52. World Health Organization Model List of Essential Medicines, 21st List, 2019 [database on the Internet]. World Health Organization. 2019. Crossref
53. Kundukad B, Schussman M, Yang K et al. Mechanistic action of weak acid drugs on biofilms. Sci. Rep. 2017; 7(1). Crossref
54. Hastings AB, Murray CD, Sendroy J. Studies of the solubility of calcium salts. II. The Solubility of Tertiary Calcium Phosphate in Salt Solutions and Biological Fluids. J. Biol. Chem. 1927; 71(3): 783–96 Crossref
55. Dolan JW. Retaining Polar Compounds; LC trouble shooting. California: LC Resources Inc., Walnut Creek, California, USA, 2001; 2–4. Crossref
56. Henderson LJ. Concerning the relationship between the strength of acids and their capacity to preserve neutrality. Am. J. Physiol.-Legacy Content 1908; 21(2): 173–9.
57. Hasselbalch KA. Die Berechnung der Wasserstoffzahl des Blutes aus der freien und gebundenen Kohlensäure desselben, und die Sauerstoffbindung des Blutes als Funktion der Wasserstoffzahl. Berlin: Biochemische Zeitschrift. 1917; 78: 112–144. Crossref
58. Noszál B, Visky D, Kraszni M. Population, Acid−Base, and Redox Properties of N-Acetylcysteine Conformers. J. Med. Chem. 2000; 43(11): 2176–82. Crossref
59. Snyder LR, Kirkland JJ, Glajch JL. Practical HPLC Method Development, Second Edition. Wiley-Interscience, New York, 1997. Crossref
60. Hamlow EE, Peck GE. The Stability of Solutions of Acetylcysteine to Oxidation During Nebulization. Anesthesiology 1967; 28(5): 934–5. Crossref
61. Lee T-Y, Chen C-M, Lee C-N, Chiang Y-C, Chen H-Y. Compatibility and osmolality of inhaled N-acetylcysteine nebulizing solution with fenoterol and ipratropium. Am. J. Health-System Pharm. 2005; 62(8): 828–33. Crossref
Affiliations
AS Prakasha Gowda
Author for correspondence:
Department of Raw Materials, Eurofins Lancaster Laboratories, LLC. 2425 New Holland Pike, Lancaster, PA 17601, USA
PrakashagowdaAladahalliSanneGowda@eurofinsus.com
Andrew D Schaefer
Department of Raw Materials, Eurofins Lancaster Laboratories, LLC. 2425 New Holland Pike, Lancaster, PA 17601, USA
Terry K Schuck
Department of Raw Materials, Eurofins Lancaster Laboratories, LLC. 2425 New Holland Pike, Lancaster, PA 17601, USA
Authorship & conflict of interest
Contributions: AS Prakasha Gowda conceived, designed, performed the experiments and wrote manuscript. Andrew D Schaefer and Terry K Schuck reviewed the manuscript. All named authors take responsibility for the integrity of the work as a whole, and have given their approval for this version to be published.
Acknowledgements: The authors wish to thank the management of Eurofins Lancaster Laboratories, LLC, Lancaster, for supporting this work. The authors would like to thank Christopher Griffin, Robert Richards, Andrew Hepner and Thomas Sharky, for their valuable technical support in HPLC and Empower program. The authors would like to extend thanks to Steven Lee for his help in ordering and taking care of reagents for this study.
Disclosure and potential conflicts of interest: The authors declare that they have no conflicts of interest.
Funding declaration: This research received no external funding. This project was supported by department of raw materials, Eurofins Lancaster Laboratories, LLC, Lancaster, PA, USA
Article & copyright information
Copyright: Published by Cell and Gene Therapy Insights under Creative Commons License Deed CC BY NC ND 4.0 which allows anyone to copy, distribute, and transmit the article provided it is properly attributed in the manner specified below. No commercial use without permission.
Attribution: Copyright © 2020 Prakasha Gowda AS, Schaefer AD, Schuck TK. Published by Cell and Gene Therapy Insights under Creative Commons License Deed CC BY NC ND 4.0.
Article source: Invited; externally peer reviewed.
Revised manuscript received: Mar 25 2020; Publication date: Apr 8 2020.