Transfer and scale-up from 10 L BioBLU®️ to Allegro™ STR 50 and STR 200 Bioreactors
Cell & Gene Therapy Insights 2021; 7(9), 1347–1362
10.18609/cgti.2021.178
Adeno-associated viruses (AAV) are established vectors for delivering gene-therapy payloads, however the cost of goods for the transfection reagents and DNA, along with challenges to scaling-up the transfection process, presents obstacles for industrialization of recombinant adeno-associated virus (rAAV) therapeutic products to overcome. The ELEVECTA® platform from CEVEC is a stable cell line with inducible AAV production which removes the need for costly transfection reagents and the need for transient transfection. In this work we show that vector production from an AAV producer cell line is scalable from the bench-scale 10 L production bioreactors to 50 L and 200 L using Pall AllegroTM STR 50 and STR 200 bioreactors and paves the way for production up to 2000 L using Pall Allegro STR 2000 bioreactor. We also demonstrate good capacity, yield and scalability for the initial unit operations of the downstream process, harvest clarification and tangential flow filtration.
Introduction
Gene therapies have the potential to cure a wide range of genetic diseases. In the majority of cases the cargo is delivered to the target cells via viral vectors. On account of its non-pathogenic nature, recombinant adeno-associated virus (rAAV) is among the most widely used viral vectors for in vivo gene therapies. In addition, AAV does not integrate into the genome and long-term expression is achieved by episomal vector genomes. AAV is currently used in about 250 clinical trials [1]Bulcha JT, Wang Y, Ma H, Tai PWL, Gao G. Viral vector platforms within the gene therapy landscape. Signal Transduct. Target Ther. 2021; 6(1): 53. . However, there are still numerous challenges concerning the production process.
Different rAAV production platforms are currently available and due to their varying key characteristics, they all have different pros and cons. For example, the need of plasmid DNA in GMP quality for transient transfection increases the cost of goods (COGs) and the transient transfection step makes scale-up difficult. Other platforms rely on an additional helper virus infection step, be it HSV, adenovirus, or baculovirus, all add an additional complication step to the rAAV production process while additionally increasing the COGs.
ELEVECTA®, the novel rAAV production platform based on stable rAAV producer cells, provides a completely new possibility of rAAV production by abolishing the need of any transient transfection or any helper virus infection step and enabling the manufacturing of viral vectors in suspension culture solely upon induction. For the generation of these stable rAAV producer cell lines, suspension CAP® cells were genetically modified to stably express Rep proteins, as well as the adenoviral helper functions E2A, E4orf6 and VA RNA. Resultant, so called Alpha AAV single cell clones were further genetically modified by stable integration of the capsid function and transgene flanked by the inverted terminal repeats resulting in a fully stable inducible rAAV producer single cell line.
For the upstream process development, basal media, supplementation and the influence of operation parameters were tested at small-scale in order to develop a robust and scalable process for high-titer and quality rAAV production. The optimized process was then successfully transferred into single-use 10 L BioBLU stirred-tank bioreactor (STR) (Eppendorf). After reproducing the small-scale results, the 10 L process was transferred to Pall and successfully reproduced. The process was further scaled to 50 L and then to 200 L using the Allegro STR system (Pall).
Materials & methods
The stable ELEVECTA rAAV producer cells used for this study were generated at CEVEC Pharmaceuticals. The cell line is based on mammalian suspension CAP cells and have stably integrated all components necessary for the production of rAAV, namely the adenovirus helper functions E1A, E1B, E2A, E4ORF6, VA RNA, as well as AAV replicase, AAV8 capsid and GFP as gene of interest (GOI) flanked by the AAV ITRs. As some of the integrated components are cytotoxic, expression of these is regulated by a doxycycline inducible promoter. Therefore, AAV production is initiated by induction via doxycycline.
Stable ELEVECTA AAV producer cells were cultured in Protein Expression Medium (Invitrogen) supplemented with 4 mM GlutaMAX (Invitrogen) in a 5% humidified incubator on an orbital shaker with a 2.5 cm throw at 200 rpm. Cells were sub-cultured until sufficient number of viable cells were available to inoculate the bioreactors.
The bioreactors were operated in batch mode using the conditions described in Table 1 and were sampled daily. The cell concentration and viability were measured using a Vi-CELL® XR (Beckman Coulter). Offline pH and dissolved gases were measured using a BioProfile FLEX® (Nova Biomedical). Culture pH was controlled using CO2 and a 70 g/L solution of sodium bicarbonate (Merck). Foam was controlled by the manual addition of Emulsion C antifoam (Merck) diluted 1 in 20 in ultrapure water.
| Table 1 Bioreactor control parameters and setpoints: agitation and airflow rate were bioreactor specific and are described in the relevant section. | ||
| Parameter | Setpoint/target | Units |
| pH | 7.15 ± 0.1 | – |
| Temperature | 37 | °C |
| Dissolved oxygen | 40 | % |
| Agitation direction | Upflow | – |
| Target inoculation concentration | 0.8 to 1.0 | 106 cells/mL |
| Cell concentration for induction on day 3 | ≥3.5 | 106 cells/mL |
| Harvest | 6 | d post-induction |
For inoculation, the number of viable cells required to achieve the target seeding density was calculated and added to the bioreactor, for each bioreactor this equated to approximately 20% of the final bioreactor volume. Expression of AAV was induced by the addition of doxycycline hydrochloride (Merck or Alfa Aesar) to a final concentration of 1 µg/mL and additional treatment with a proprietary supplement. On harvest day, DENARASE® (c-LEcta) was added to a final concentration of 7.5 units/mL and incubated for 2.0 h.
The bench-scale bioreactor was a single-use BioBLU 10c (Eppendorf) and was connected to a BioFlo® 320 control tower (Eppendorf). The large-scale bioreactors were Allegro STR 50 and STR 200 single-use bioreactors (Pall) and were controlled from the standard controller. For both BioBLU and Allegro bioreactors, culture pH and dissolved oxygen were measured using conventional reusable probes (Mettler Toledo).
Depth filtration was performed on material immediately following the bioreactor production culture. Supracap® 50 (Pall) devices were used for the process development, while Supracap 100 (Pall), or Stax™ (Pall) capsules were used for the harvest at 10 L to 200 L production scale. For filterability trials, the filters were flushed with deionized wa[w/v). For the filterability trials], [500 mL of bioreactor harvest was availa]ble for each filtration train. The filters evaluated are detailed in Table 2. In total three filter trains were evaluated, K700P-V100P, PDK11, and, PDP8-V100P. During clarification at the 10 L production scale and above, the process was performed at 100 LMH based on the area of the V100P filter stage, in addition, 23 L of equilibration buffer was used per m2 to increase product recovery by displacement of the hold-up volume and dissociation of adsorbed product. Clarification of the 50 L and 200 L production scale batches was performed using an Allegro MVP advanced (Pall) automated pump skid.
| Table 2 Details of the filter media evaluated for harvest clarification. | ||
| Media grade | Type | Pore size (µm) |
| PDK11 (K900P/V100P) | Dual layer depth | 20–2 |
| K900P | Single layer depth | 20–8 |
| V100P | Single layer depth | 4–2 |
| PDP8 (T1500P/K700P) | Dual layer depth | 30–6 |
| K700P | Single layer depth | 15–6 |
| T1500P | Single layer depth | 30–12 |
| EAV | Membrane | 0.2 |
Concentration was performed by tangential flow filtration (TFF) using OmegaTM (Pall) cassettes with a retention rating of 100 kDa, equilibrated using the equilibration buffer. Process development and processing of material from 10 L production scale was performed using ÄKTA® Crossflow (Cytiva), while the concentration of material from 50 L and 200 L production scale was performed using an ÄKTA readyflux® system (Cytiva).
Viral titer determination was performed via qPCR (Agilent). Primer/dual-labelled probe combination directed against the SV40pA was used to measure the viral titer. As standard, linearized transgene plasmid with a defined copy number was used. Correct concentration of the used plasmid standard was confirmed via ddPCR (Biorad).
Results & discussion
Transfer of Bioreactor Parameters from BioBLU 10c to Allegro STR 50 Bioreactor
As part of the characterization of the Allegro STR bioreactor range, Pall has developed models to facilitate both transfer of processes from other bioreactors to the Allegro system and scale-up within the bioreactor range from 50 L to 2000 L. The key parameters used for the transfer from the BioBLU were provided by the manufacturer (Table 3). These were used to determine the operating parameters in the Allegro STR 50 bioreactor (Table 3), using the aforementioned model of the Allegro system.
| Table 3 Key vessel characteristics used to calculate the equivalent operating parameters between the BioBLU 10c and the Allegro STR 50 bioreactor systems. | ||||
| Bioreactor | Impeller diameter (mm) | Working volume (L) | Vessel diameter (m) | Ungassed specific power number (Po) |
| BioBLU 10c | 91.8 | 10 | 0.204 | 3.33 |
| Allegro STR 50 | 185 | 50 | 0.38 | 1.9 |
There are many ways that processes can be transferred from one system to another, the most commonly used being a combination of maintaining a combination of either power input per volume, tip speed, superficial gas velocity, VVM or kLa [2]Nienow, Alvin. Mass Transfer and Mixing Across the Scales in Animal Cell Culture. Animal Cell Culture 2015; 9: 137–67. , [3]Xing Z, Kenty BM, Li ZJ, Lee SS. Scale-up analysis for a CHO cell culture process in large-scale bioreactors. Biotechnol. Bioeng. 2009; 103(4): 733–46. Xing Z, Kenty BM, Li ZJ, Lee SS. Scale-up analysis for a CHO cell culture process in large-scale bioreactors. Biotechnol. Bioeng. 2009; 103(4): 733–46. . It is not possible to maintain all of these varied parameters exactly the same between systems due to design differences, and ultimately it is therefore necessary to fix on a subset of parameters for the transfer. Based on data obtained during characterization studies of Allegro STR bioreactor across different scales, it was decided to maintain the power input per volume and the superficial gas velocity constant, to ensure that similar mixing and mass transfer were achieved in the different systems.
The BioBLU 10c process was operated with agitation at 200 rpm and a constant air flow rate of 0.2 L/min. The power input per volume and superficial gas velocity of the process in the BioBLU 10c were determined (Table 4). Based on these values, the agitation speed and sparger air flow rate to operate at in the Allegro STR 50 bioreactor were calculated, resulting in an agitation speed of 128 rpm and an air flow rate of 0.8 L/min. Additional parameters that can be used for transfer were also calculated (Table 4).
| Table 4 Key calculated parameters from transfer between bioreactors whilst maintaining constant power input and superficial velocity. | ||
| Parameter | BioBlu 10c | Allegro STR 50 |
| Power input per volume (W/m3)* | 80 | 80 |
| Superficial gas velocity (m/s)* | 0.1 | 0.1 |
| Agitation speed (rpm) | 200 | 128 |
| Sparger air flow rate (L/min) | 0.2 | 0.8 |
| kLa 2080 (/h) | 3 | 2.5 |
| Tip speed (m/s) | 1 | 1.2 |
| VVM | 0.02 | 0.02 |
| Kolmogorov length (µm) | 58.4 | 58.3 |
| KLa 2080 was determined between 20 and 80% dissolved oxygen. *Parameters maintained constant during process transfer. | ||
Having determined the operating parameters required, the process was run in the BioBLU 10c and then the Allegro STR 50 bioreactors. The BioBLU 10c was inoculated directly from shake-flask cultures to the final working volume using a 1 in 5 dilution. For the Allegro STR 50 bioreactor, to reduce the number of shake-flasks required, the bioreactor was operated at an initial lower volume of 12.5 L to generate sufficient cells. When the viable cell concentration was >4 x 10⁵ cells/mL, the bioreactor was drained to 9.7 L and the culture diluted 1 in 5 to the final working volume to achieve the desired seeding density.
The pre-induction specific growth rate of the cells in the Allegro STR 50 was higher than in the BioBLU 10c, at 0.025/h compared to 0.021/h. The maximum viable cell concentration achieved was also higher at 6.3 x 10⁶ cells/mL in the Allegro STR 50 bioreactor compared to 4.8 x 10⁶ cells/mL in the BioBLU 10c bioreactor (Figure 1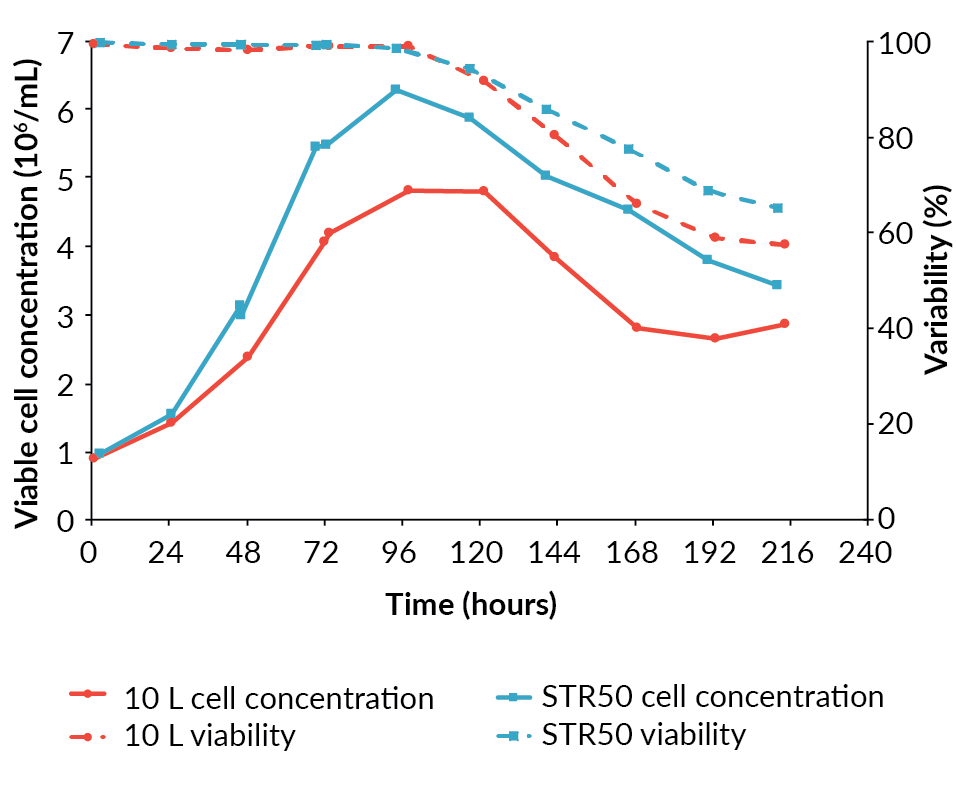
Viral genome concentration was measured by qPCR from 2 days post-induction until 6 days post-induction (final harvest), both in the supernatant and the whole lysed cell suspension (Figure 2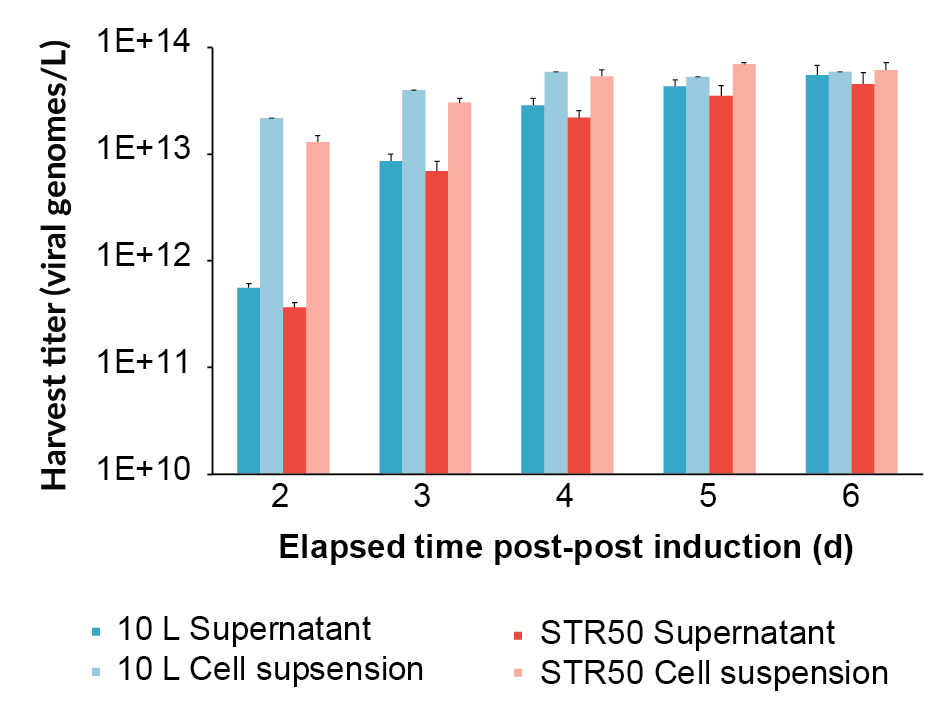
Having achieved a successful transfer from the BioBLU 10c to the Allegro STR 50 bioreactor, an additional Allegro STR 50 bioreactor was operated under identical conditions to confirm reproducibility prior to scaling-up. The cell growth and viability profiles for the two Allegro STR 50 runs were similar (Figure 3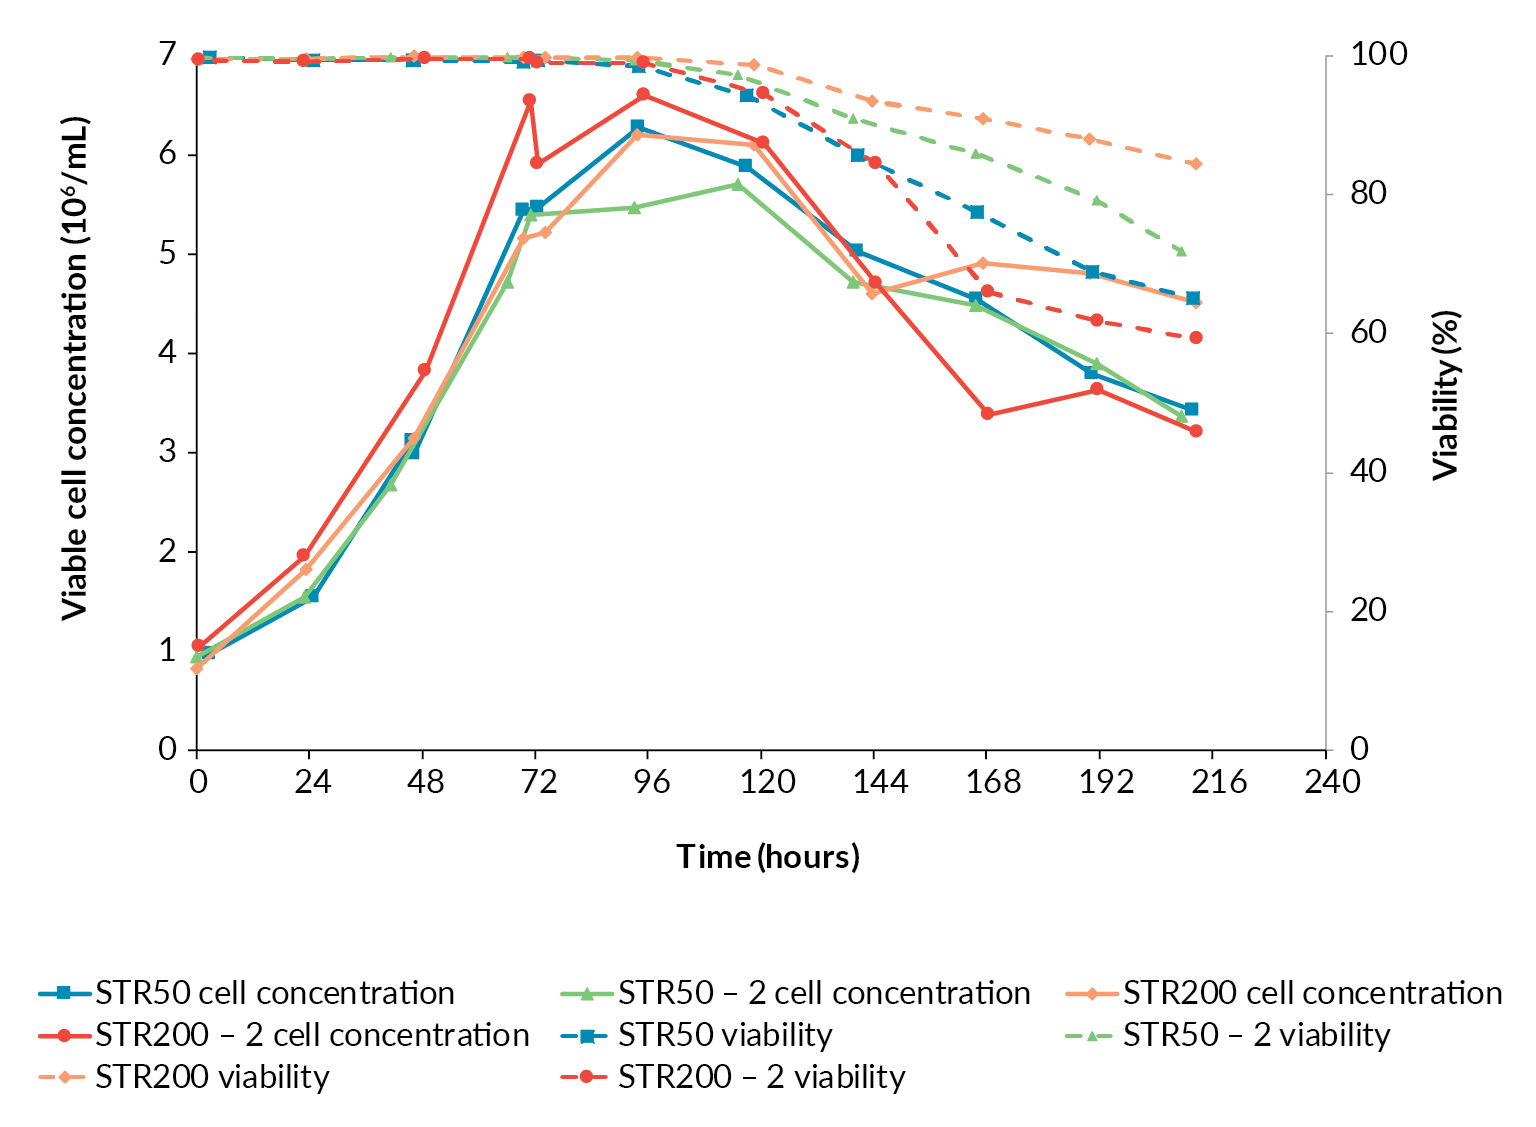
Scale-Up from 50 to 200 L
To scale-up the process from the Allegro STR 50 to the Allegro STR 200 bioreactor, the same parameters used for the technology transfer were maintained, namely the power input per volume and the superficial gas velocity. The agitation speed and sparger air flow rate required to operate at in the Allegro STR 200 bioreactor were calculated, resulting in an agitation speed of 96 rpm and an air flow rate of 2.1 L/min. Additional parameters that can be used for scale-up were also calculated (Table 5).
To generate sufficient cells for inoculation of the Allegro STR 200 bioreactor, cells were expanded using the Allegro STR 50 bioreactor operated with the same parameters previously described. Then the 200 L production bioreactor was seeded directly from the STR 50 L to achieve the final working volume.
| Table 5 Key calculated parameters for scale-up whilst maintaining constant power input and superficial gas velocity. | ||
| Parameter | Allegro STR 50 | Allegro STR 200 |
| Power input per volume (W/m3)* | 80 | 80 |
| Superficial gas velocity (m/s)* | 0.1 | 0.1 |
| Agitation speed (rpm) | 128 | 96 |
| Sparger air flow rate (L/min) | 0.8 | 2.1 |
| kLa 2080 (/h) | 2.5 | 2.5 |
| Tip speed (m/s) | 1.2 | 1.5 |
| VVM | 0.02 | 0.01 |
| Kolmogorov length (µm) | 58.3 | 58.3 |
| *Parameters maintained constant. | ||
The growth profiles for the two Allegro STR 200 bioreactor runs followed the same trends as observed in the two 50 L runs. The second STR 200 run was inoculated at the top of the target range and grew to a slightly higher cell concentration (Figure 3). Overall, the scale-up in terms of cell growth and viability was considered successful.
The harvest viral genome titer on day 6 post-induction, as measured by qPCR, for the supernatant and the whole lysed cell suspension for all the bioreactors is shown in Figure 4. The process scaled-up well, achieving a similar viral genome yield at all scales. The original BioBLU 10c lab-scale process yield was 5.5 x 10¹³ vg/L (n=1 bioreactor) in the supernatant, whilst the average for the Allegro STR 50 cultures was 6.2 x 10¹³ vg/L (n=2 bioreactors) and the Allegro STR 200 cultures was 5.7 x 10¹³ vg/L (n=2 bioreactors).
One concern regarding scale-up of mammalian cell culture processes is the accumulation of CO2 within the culture when the process is operated at larger volumes [3]Xing Z, Kenty BM, Li ZJ, Lee SS. Scale-up analysis for a CHO cell culture process in large-scale bioreactors. Biotechnol. Bioeng. 2009; 103(4): 733–46. Xing Z, Kenty BM, Li ZJ, Lee SS. Scale-up analysis for a CHO cell culture process in large-scale bioreactors. Biotechnol. Bioeng. 2009; 103(4): 733–46. . The Allegro STR 50 and STR 200 cultures followed similar CO2 profiles irrespective of scale and there was no evidence of CO2 accumulation as the cultures progressed (Figure 5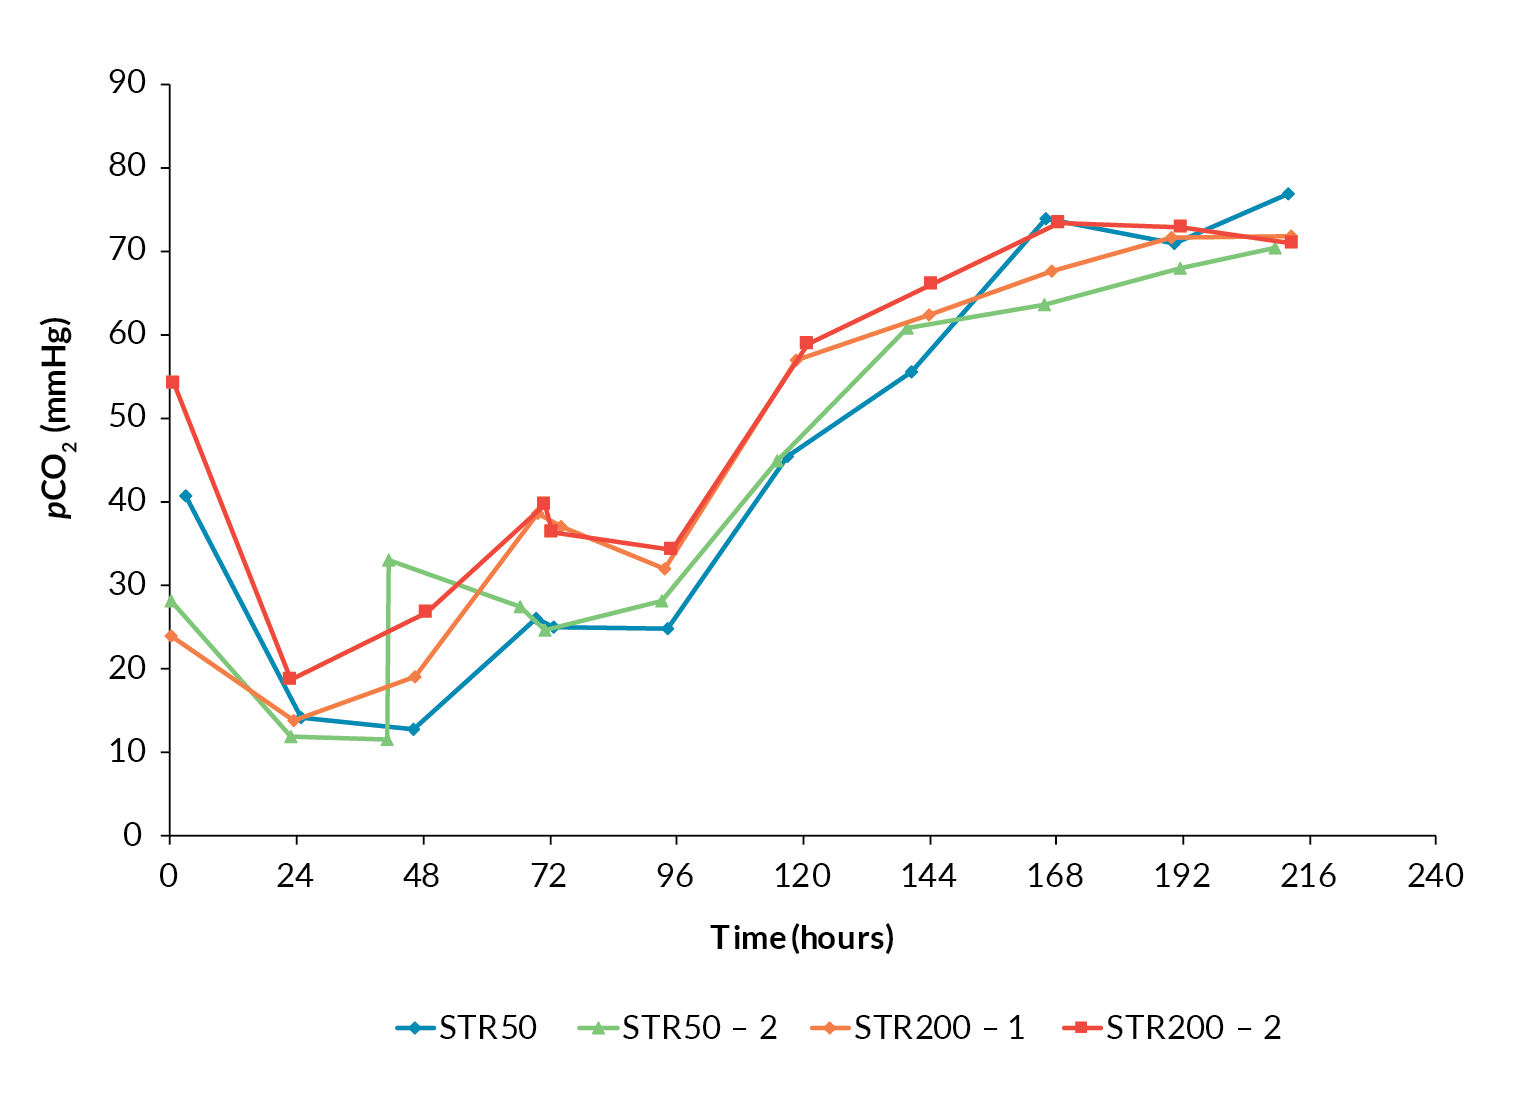
This confirmed that the gassing strategy applied was sufficient to avoid CO2 accumulation during further scale-up.
Clarification development & scale-up
Development of the clarification process for the ELEVECTA production process was approached using historical knowledge to select suitable filters for AAV processing within the Pall Seitz® high performance depth filter range. These filters have a high capacity for the cellular debris from production culture and lysis process combined a high yield for AAV product. The selected filters contained a mixture of perlite and diatomaceous earth which are effective for clarification of AAV production processes. In addition, membrane filters we evaluated to further clarify the depth-filtered material reducing the particulate load for subsequent processing step.
Initial evaluation of clarification & bioburden reduction at small scale
The amount of material limited the depth filtration evaluation to three different depth filtration trains (Table 6). The filtration train of K700P and V100P reached a capacity of 177 L/m2 at the terminal pressure (Figure 6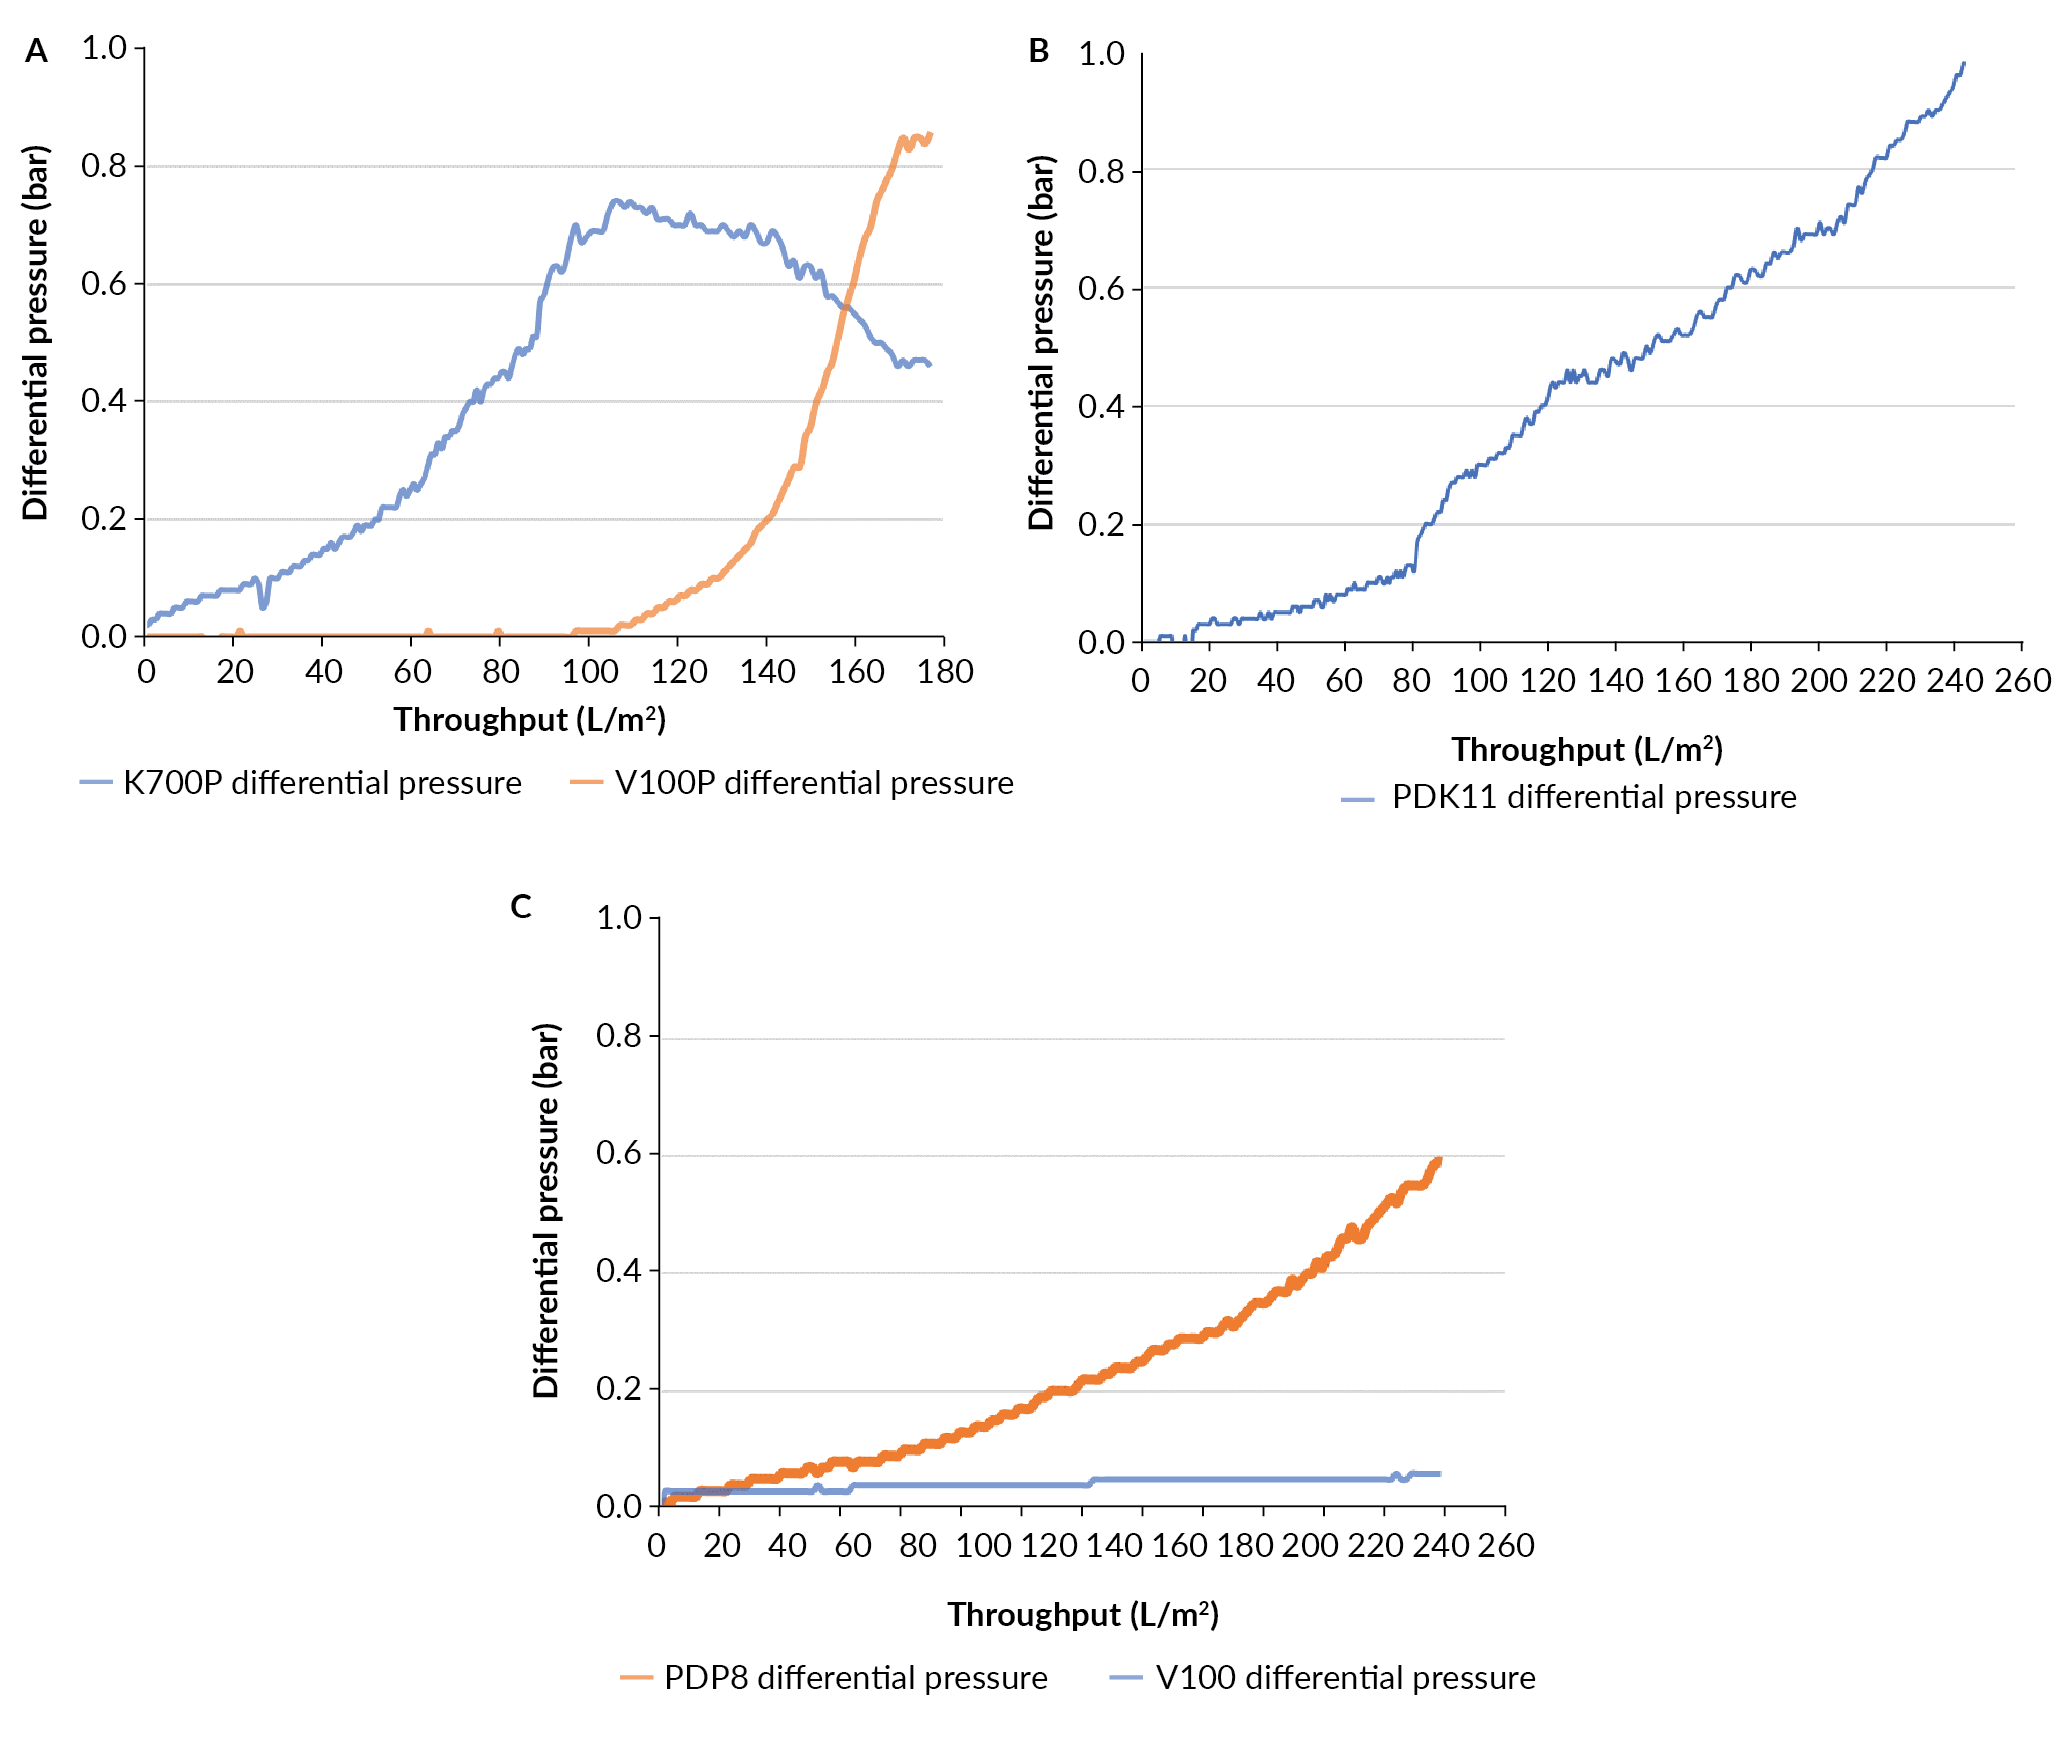
| Table 6 Processing parameter and filter identification for clarification process development. | |||
| Filter train | Filter 1 | Filter 2 | Flux target (LMH) |
| 1 | K700P | V100P | 50 |
| 2 | PDK11 (K900P/V100P) | n/a | 50 |
| 3 | PDP8 (T1500P/K700P) | V100P | 100 |
| 4 | EAV | n/a | 200 |
Evaluation of the membrane filter EAV was performed on the material filtered through the PDP8/V100P filter train. The capacity of the EAV filter was 173 L/m2 before reaching 1.0 bar (data not shown).
As seen in Figure 7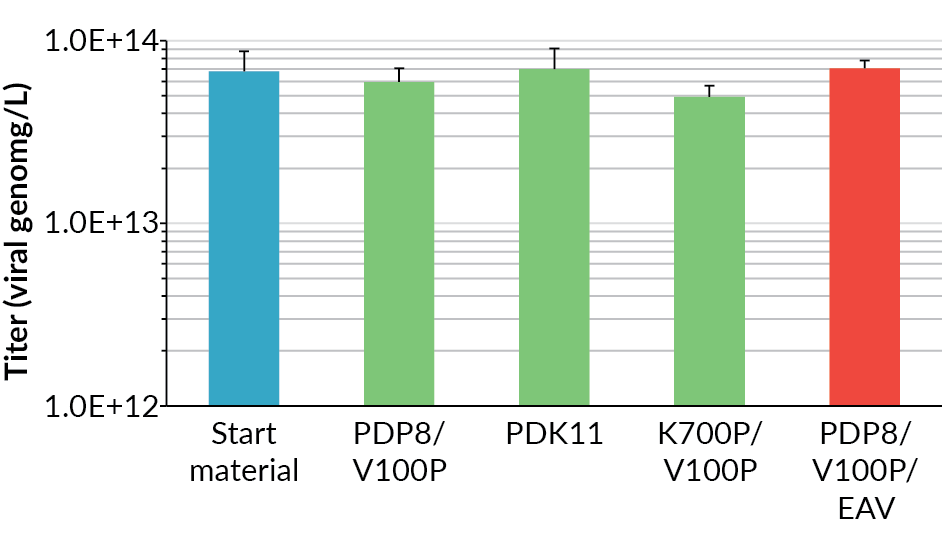
The filtration train of PDP8, V100P and EAV was chosen for scale-up. Although the PDP8 and V100P showed different capacity, a ratio of 1:1 was used better align with the discrete filter capsules available. The process development based on the small-scale tests allowed determination of the depth filter area needed for the different production process scale with the constraint that the safety factor was 50% or greater (Table 7).
Evaluation at 10 L
Following on from the clarification development, the PDP8-V100P-EAV clarification filtration train was evaluated using material from a 10 L bench-scale bioreactor, with the material identified for the development of further purification steps. The harvest of a 10 L bench-top bioreactor used a filter train of 0.05 m2 PDP8, 0.05 m2 V100P and 0.21 m2 EAV, with a safety factor of 58% using Supracap 100 depth filters capsules. In this filter train the EAV filter is oversized based on filter sizing, however, this filter was used due to availability.
The filtration of the bioreactor proceeded well. The differential pressure increased on the PDP8 filter up to 0.38 bar at the end of the process (Figure 8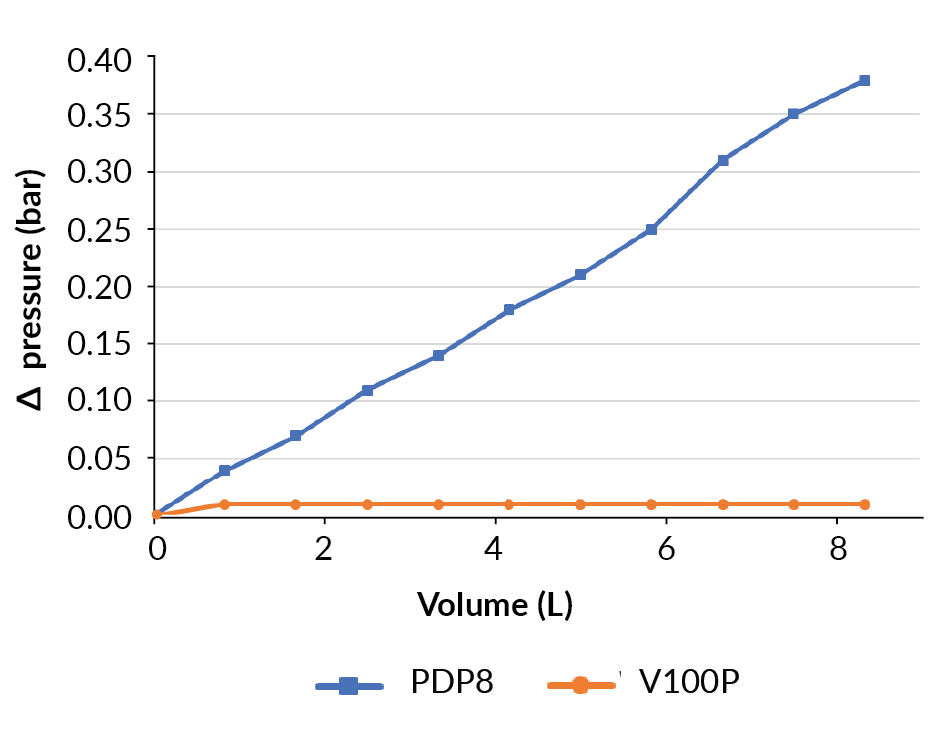
Evaluation at 50 L
As the clarification at the 10 L production scale went without issue, scale up to clarification of the 50 L production was performed without any changes to the filter train sizing as planned in Table 7. The filtration train consisted of 0.25 m2 PDP8 and 0.3 m2 V100P depth filters and 0.42 m2 EAV membrane filter, and process set point was 100 LMH based on V100P. For this harvest, the Allegro MVP advanced was used, an automated pump skid with multiple inlet and outlet valves in addition to on-line data recording (Figure 9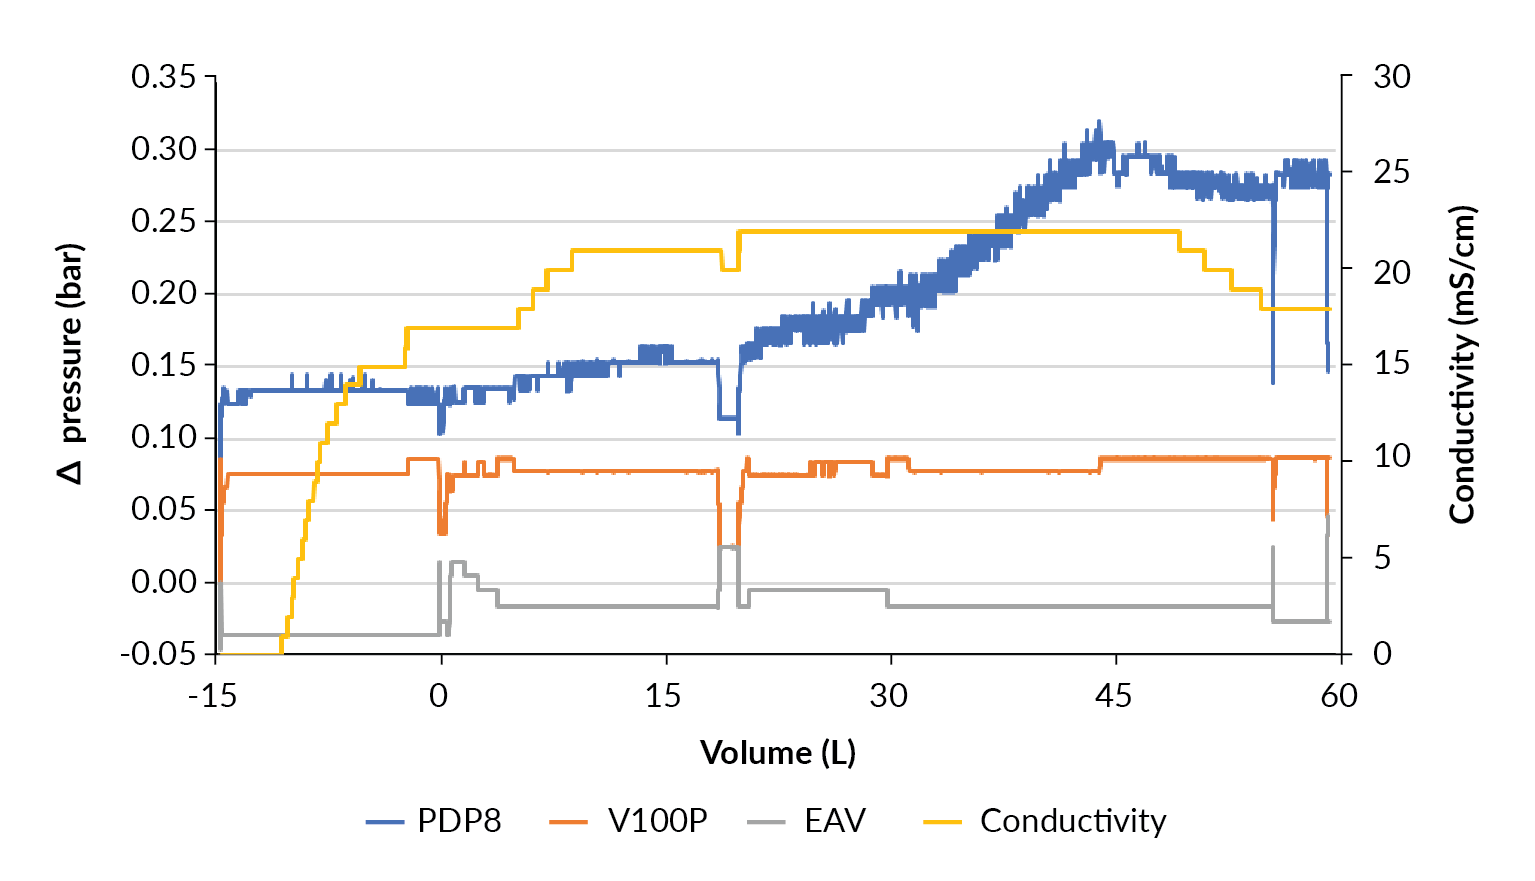
During the last third of the product loading phase, from 30 L, the pressure drop across the PDP8 stage increased from 0.18 bar to 0.33 bar. This is far below any increase that would be a concern for processing. There was no pressure increase observed for the other filtration stages like the observations seen at the 10 L production scale.
| Table 7 Filter capacity table, projected sizing from 10 L to 200 L and safety factors (SF; %). | ||||||
| Volume (L) | PDP8 capacity – 315 L/m2 | V100P capacity – 315 L/m2 | ||||
| Area projection (m2) | Area used (m2) | SF | Area projection (m2) | Area used (m2) | SF | |
| 10 | 0.032 | 0.05 | 58% | 0.032 | 0.05 | 58% |
| 50 | 0.159 | 0.25 | 58% | 0.159 | 0.30 | 89% |
| 200 | 0.635 | 1.0 | 58% | 0.635 | 1.0 | 58% |
Evaluation at 200 L
With the confidence that the clarification train works well, the process was scaled up to harvest a 200 L STR using a filter train of 1.0 m2 PDP8, 1.0 m2 V100P and 2.12 m2 EAV filters. When the bioreactor was drained, 40 L of equilibration buffer was used to flush the filter hold-up volume and desorb product from the filters (Figure 10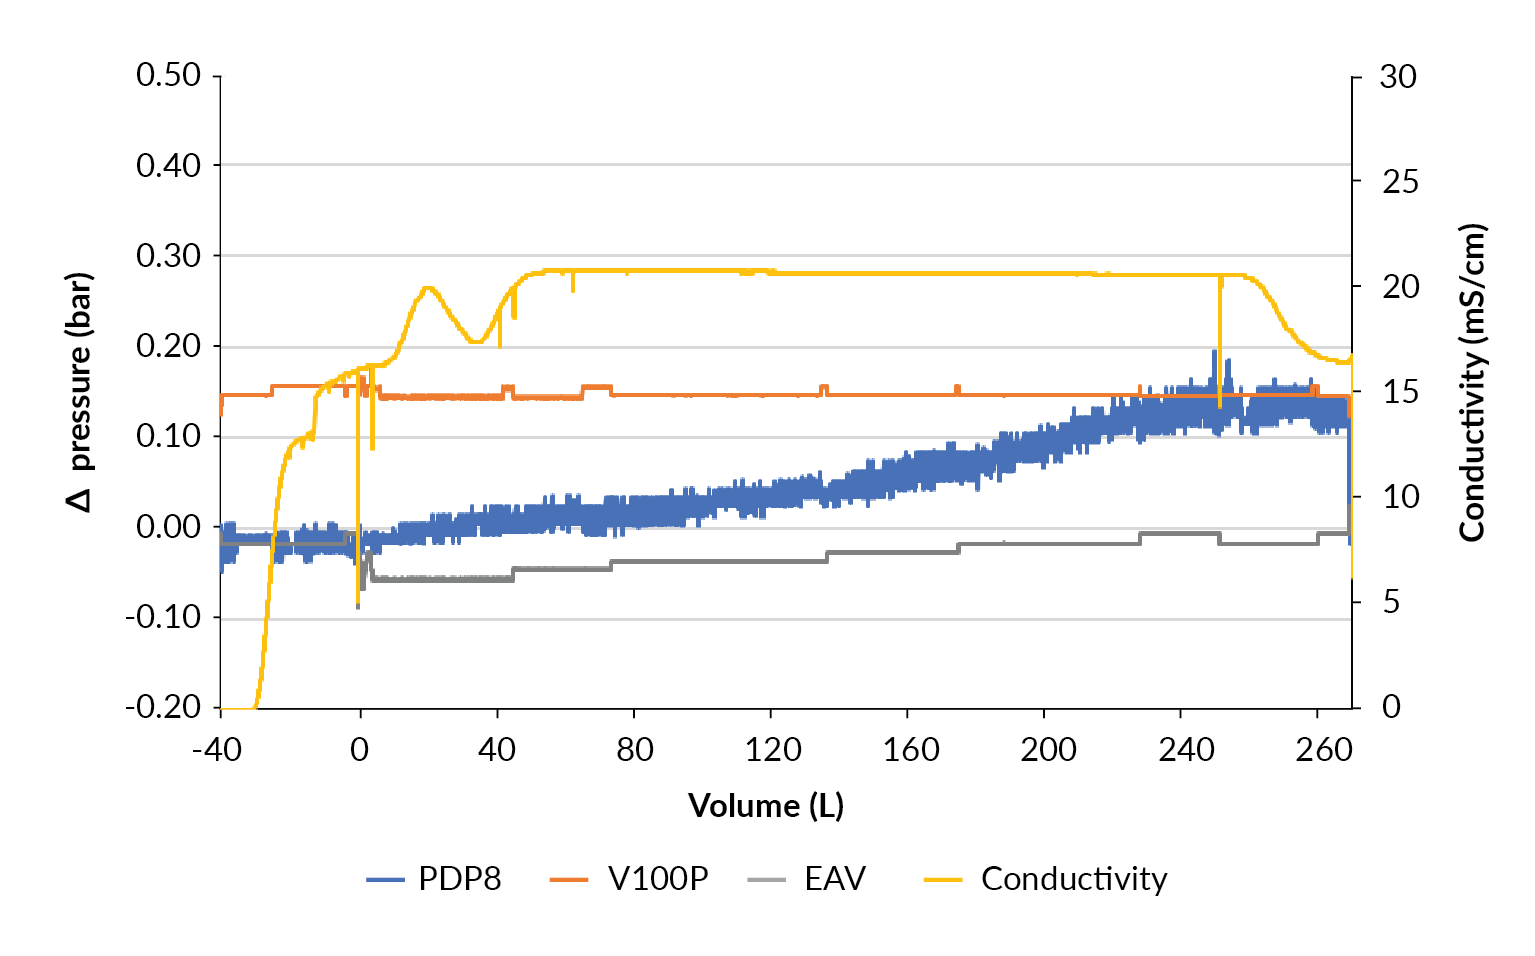
TFF development & scale-up
After clarification, the main objective is to reduce the volume that is going on to subsequent purification steps in the downstream process and this is achieved by tangential flow filtration (TFF). Pall Omega TFF cassettes are well suited for AAV processing, the membranes are made of low product-binding PES and the AAV-suitable 100 kDa MWCO retention rated cassettes are available in a gamma-irradiated format which removes the need for pre-process sanitization. The TFF development study was performed immediately after clarification of the 10 L production vessel. This helps to mitigate against any storage related process artefacts and was also performed with the end process in mind. The final anticipated production process in a GMP facility would be able to perform harvest, clarification and TFF all within one shift.
This process requires only ultrafiltration, no buffer exchange is necessary. Prior to starting TFF, the clarified cell culture fluid was treated with stabilizing additives. TFF parameter scouting was performed using 2.0 L of the conditioned filtrate and a 0.02 m2 Omega 100 kDa MWCO membrane. Cross-flow flux was scouted before TMP. A conversion of between 0.2 and 0.3 was the target for processing. In the cross-flow flux excursion, 3.5 L/m2/min (LMM) and 5.0 LMM have similar permeate flux but the conversion is more favorable for 3.5 LMM, so this parameter was taken forward (Table 8). TMP scouting experiments showed increasing permeate flux with increasing TMP as expected. A choice of TMP of 0.4 bar or 0.55 bar would be acceptable, however the higher TMP reduces the unit operation time due to the higher permeate flux. 0.55 bar TMP and 3.5 LMM cross flow flux were chosen for the concentration step.
The experiment proceeded to concentrate 2.0 L to 100 mL – a 20-fold concentration. Over the concentration phase the permeate flux decayed from 1.13 to 0.75 LMM, 33% flux decay for a capacity of 81.5 L/m2. The product was recovered with an additional buffer flush.
To verify these processing conditions, an initial scale-up was performed to concentrate the remaining 7.0 L of the clarified harvest using a 0.1 m2 Omega 100 kDa MWCO cassette. Here, using 0.55 bar TMP and 3.5 LMM the maximum permeate flux observed was 2.88 LMM which decayed to 1.97 LMM after 20-fold concentration at a capacity of 76.5 L/m2 and a flux decay of 31%. The whole ultrafiltration process and recovery was performed within 2 hours with a step vg yield of 182%. The flux for this concentration process is higher than was observed for the development, final flux of 1.97 LMM vs 0.75 LMM, this can be explained by both a lower loading and that the concentration development phase was performed after parameter scouting and so some fouling may have been present, a similar level of flux decay was seen in both instances.
| Table 8 TFF parameter scouting. | |||||
| Cross flow flux (LMM) | TMP (bar) | Retentate flow rate (mL/min) | Permeate flow rate (mL/min) | Permeate flux (LMM) | Conversion |
| 3.5 | 0.40 | 65.1 | 23.1 | 1.215 | 0.26 |
| 5.0 | 0.40 | 93.3 | 22.4 | 1.220 | 0.19 |
| 2.0 | 0.40 | 37.2 | 20.9 | 1.052 | 0.35 |
| 3.5 | 0.41 | 65.1 | 19.6 | 1.027 | 0.22 |
| 3.5 | 0.54 | 65.3 | 24.0 | 1.365 | 0.27 |
| 3.5 | 0.69 | 65.8 | 29.4 | 1.535 | 0.31 |
As with the scale-up of the depth filter, the TFF cassettes are available in discrete sizes, however similar loading between the different scale is the criteria for scale-up. For the 50 L production process, 0.5 m2 of 100 kDa MWCO Omega T-series cassette was used to concentrate the harvest filtrate 20-fold (Figure 11). This was executed as an automated method using an ÄKTA readyflux. Processing parameters were set to be 3.5 LMM retentate flow and TMP 0.55 bar. For the bulk of the process the retentate volume was 15 L, the final concentrated volume was 2.05 kg and 0.85 kg of buffer was used to increase recovery, the step yield was 86.1%. The initial flux was 1.5 LMM and this decayed to 0.7 LMM, a decay of 53% over the process for a product loading of 96 L/m2. This process lasted slightly longer than the process from the 10 L production culture as the permeate flux was lower throughout, but the increased loading can account for this extended time as there is a larger amount to filter and also a higher degree of fouling when compared to the process at 10 L scale. The whole process was completed within 170 min.
In a similar manner to the TFF process at the 50 L scale, the 200 L process was performed using 2.5 m2 of Omega T-series 100 kDa MWCO and an ÄKTA readyflux. As before, the TMP and retentate flux were set to 0.55 bar and 3.5 LMM respectively. A target of 20× volume reduction was set from the bioreactor volume. During the process the permeate flow rate decayed from 1.4 LMM to 0.45 LMM for a loading of 91.6 L/m2 (Figure 12). The flux decay was greatest of all at this scale. The product was concentrated to 8.75 kg retentate weight and 1.00 kg of equilibration buffer was used to increase product recovery. In total 11.8 kg of concentrated product was recovered, a 17-fold volume reduction and a step vg yield 124% to 126%. The whole process took 2 hours 25 minutes.
Conclusions
The production process for the stable AAV producer cell line from CEVEC was successfully transferred from operation in the bench-scale BioBLU 10c vessel into the Allegro STR 50 bioreactor using the criteria of maintaining power input per volume and superficial gas velocity between the two bioreactors. While a difference was observed in the growth rate and maximum viable cell concentration between the two bioreactors, the viral titer was equivalent.
The process was scaled-up from the Allegro STR 50 to the Allegro STR 200 bioreactor using the same scaling strategy of maintaining power input per volume and superficial gas velocity, was successful, resulting in the same growth profile and viral yield between the scales. Additionally, the process was also reproducible as replicate runs at each scale resulted in similar growth and viral yields.
In this study, the process was scaled from 10 L to 200 L, however, using the same scale-up strategy the process could be scaled-up further, for example to the Allegro STR 2000 bioreactor. The lack of CO2 accumulation as the process was scaled-up gives additional confidence to the approach chosen.
The initial downstream unit operations for this process were developed using small-scale devices. We successfully scaled this up to 10 L production scale where the performance was in line with expectations. From there we linearly scaled up to the 200 L production scale, and foresee no issues in further scale up.
These here shown study demonstrates, that due to the absence of any transient transfection step or helper-virus infection scale-up of the stable ELEVECTA AAV producer platform is straight forward and reproducible. The combination of the stable AAV producer platform with the single-use easy to scale-up Allegro STR bioreactor allows hassle free upstream process development for AAV gene therapy products therefore reducing time to market and COGs.
References
1. Bulcha JT, Wang Y, Ma H, Tai PWL, Gao G. Viral vector platforms within the gene therapy landscape. Signal Transduct. Target Ther. 2021; 6(1): 53. Crossref
2. Nienow, Alvin. Mass Transfer and Mixing Across the Scales in Animal Cell Culture. Animal Cell Culture 2015; 9: 137–67. Crossref
3. Xing Z, Kenty BM, Li ZJ, Lee SS. Scale-up analysis for a CHO cell culture process in large-scale bioreactors. Biotechnol. Bioeng. 2009; 103(4): 733–46. Crossref
Affiliations
David Mainwaring
Principal Scientist, Pall
Amar Joshi
Senior Scientist, Pall
Juliana Coronel
CEVEC Pharmaceuticals GmbH
Christian Niehus
CEVEC Pharmaceuticals GmbH

Authorship & Conflict of Interest
Contributions: All named authors take responsibility for the integrity of the work as a whole, and have given their approval for this version to be published.
Acknowledgements: None.
Disclosure and potential conflicts of interest: The authors disclose that Pall Corporation owns patents relevant to the Biotech Industry. J Coronel and C Niehus declare that they are employees of Cevec Pharmaceuticals. D Mainwaring and A Joshi declare that they are employees of Pall Corporation. J Coronel has one patent pending related to ELEVECTA. The authors declare that they have no other conflicts of interest.
Funding declaration: Studies were performed as part of a fee from CEVEC for service.
Article & copyright information
Copyright: Published by Cell and Gene Therapy Insights under Creative Commons License Deed CC BY NC ND 4.0 which allows anyone to copy, distribute, and transmit the article provided it is properly attributed in the manner specified below. No commercial use without permission.
Attribution: Copyright © 2021 Pall Corporation Published by Cell and Gene Therapy Insights under Creative Commons License Deed CC BY NC ND 4.0.
Article source: Invited; externally peer reviewed.
Submitted for peer review: Sep 27 2021; Revised manuscript received: Oct 21 2021; Publication date: Nov 25 2021.