Evaluating DNA purity ratio determination with the CTech™️ SoloVPE®️ System
Cell & Gene Therapy Insights 2022; 8(8), 1047–1054
DOI: 10.18609/cgti.2022.155
Spectrophotometric analysis is one of the most common techniques used to quantitate nucleic acids in a solution. More specifically, the 260/280 UV absorbance ratio of the nucleic acid can be used to determine their purity [1]Huss VAR, Festl, H, Schleifer KH. Studies on the spectrophotometric determination of DNA hybridization from renaturation rates. Syst. Appl. Microbiol. 1983; 4(2), 184–192. . However, traditional fixed-pathlength spectrophotometers have limitations when determining the purity ratios of these molecules. In this study, the CTechTM SoloVPE® system assessed theoretical DNA purity ratios by utilizing its variable pathlength method, known as Slope Spectroscopy®. The method was evaluated by assessing the specificity, intermediate precision, repeatability, linearity, and accuracy of the theoretical purity ratios. The observed purity ratios from the SoloVPE system demonstrated great comparison to the theoretical purity ratios, verifying the SoloVPE system’s slope spectroscopy method to be preferable for this application.
Introduction
Gene therapy is an emerging medical approach to treating, preventing, and curing a wide range of genetic diseases. By administering genetic material into defective cells, the transgene has the potential to repair or enhance the cell’s native genetic material. In order to successfully implement this approach in downstream bioprocessing, it is imperative to understand the purity of DNA. The purity is related to the quality and in many instances, the efficacy of the samples, ensuring that they are free of proteins, lipids, salts, and other contaminants [2]Glasel JA. Validity of nucleic acid purities monitored by 260nm/280nm absorbance ratios. Biotechniques 1995; 18(1), 62–63..
UV-Vis spectroscopy is the most common analytical method to determine DNA purity. The ratio of the absorbance at 260 nm and 280 nm is used to analyze the purity of nucleic acids [3]Sambrook JF, Russell. DW. Molecular Cloning: A Laboratory Manual (3rd ed.). 2001, Cold Spring Harbor Laboratory Press.Sambrook JF, Russell. DW. Molecular Cloning: A Laboratory Manual (3rd ed.). 2001, Cold Spring Harbor Laboratory Press.. This ratio is widely known as the R value, where pure DNA260/280 is between 1.8 and 2.0 [3]Sambrook JF, Russell. DW. Molecular Cloning: A Laboratory Manual (3rd ed.). 2001, Cold Spring Harbor Laboratory Press.Sambrook JF, Russell. DW. Molecular Cloning: A Laboratory Manual (3rd ed.). 2001, Cold Spring Harbor Laboratory Press.. Since proteins absorb at 280 nm, this ratio is used to assess the amount of protein contamination within the sample [4]Nucleic Acid Quantitation - an overview | ScienceDirect Topics. ScienceDirect. (Accessed Jun 2022). Impurities in DNA can lead to inaccurate measurement of DNA concentration and risk adversely impacting any subsequent downstream processes or therapeutic potential [5]Matlock B. Assessment of Nucleic Acid Purity. Thermo Scientific 2015. (Accessed Jun 2022).
Traditional UV-Vis spectrophotometers utilize the Beer-Lambert law to calculate a sample’s concentration. Beer’s law states that A = ε*l*c where A is the measured absorbance, ε is the molar absorption coefficient, l is the pathlength, and c is the concentration of the sample. Since traditional spectrophotometers utilize a fixed 1 cm pathlength, samples may require dilution which can lead to assay error. In the case of highly concentration DNA, samples must be diluted to ensure that the assays are within the linear range of the instrument. Because of the instrument’s limit of detection, linear range, and fixed pathlength, serial dilution is required, which can introduce error.
The SoloVPE System is an increasingly popular UV-Vis technology that utilizes the Slope Spectroscopy method to analyze sample concentrations. The Slope Spectroscopy method is an analytical manipulation of Beer’s law that allows the SoloVPE System to perform variable pathlength measurements. Rather than relying on a single absorbance value, the Slope Spectroscopy method creates section data based on the collected absorbance values per pathlength. To enable the Slope Spectroscopy equation, the pathlength term l is moved to the left side of the equation where A/l = ε*c. The A/l term is the change in absorbance per change in pathlength, which is also known as the slope m of the equation. This substitution results in the Slope Spectroscopy equation which can be expressed as m = ε*c. The slope is the most critical value within the equation, as it allows us to determine the sample concentration or molar absorption coefficient [6]Jones-Goldstein DM, Jones M, Haydu S. Determination of plasmid DNA purity ratio in human gene therapy products using slope spectroscopy method. Repligen Corporation 2021 (Feb 22). (Accessed Jun 2022).
The SoloVPE System defines its pathlength range by measuring the distance between the bottom of the CTechTM Fibrette® Optical Component and the bottom of the sample vessel. The SoloVPE System’s integrated hardware and software allow it to move the Fibrette Optical Component up and down from 5 µm to 15 mm, with a pathlength resolution of 5 µm steps (Figure 1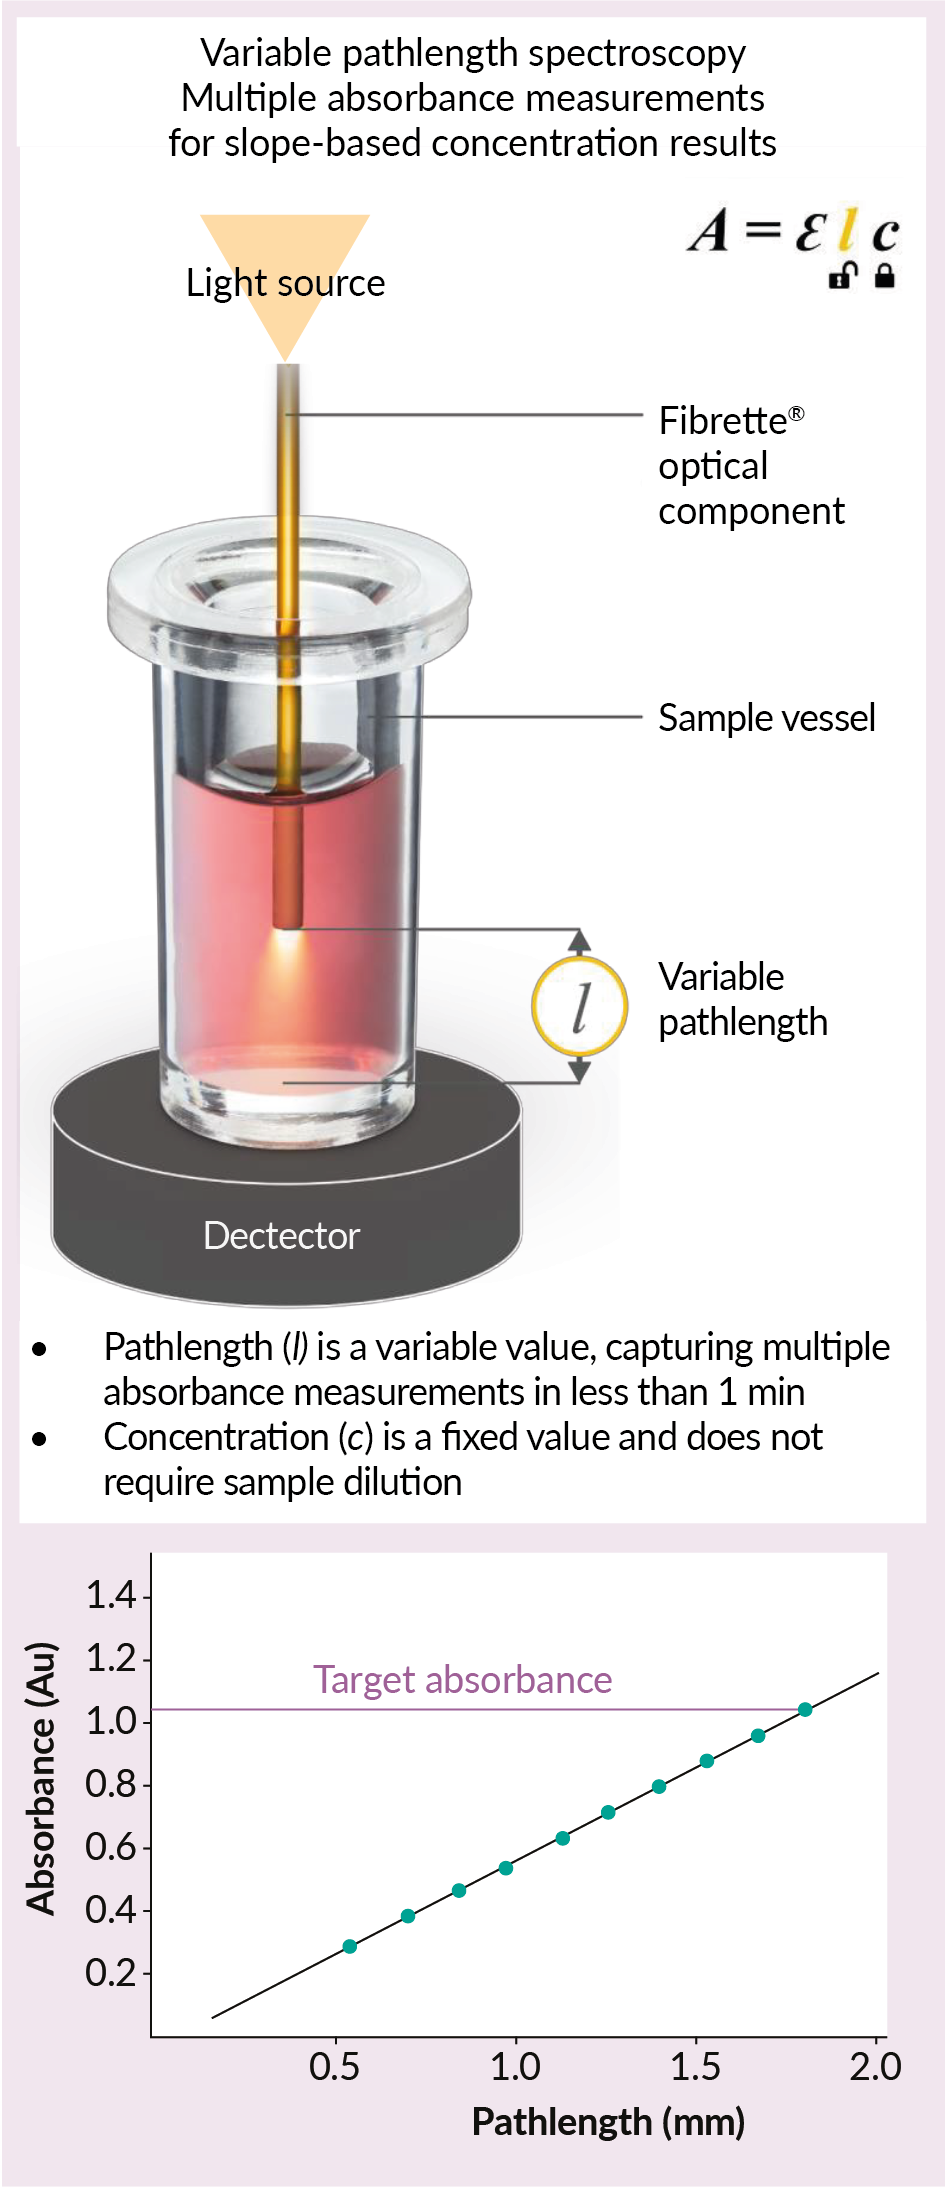 Mechanism of variable pathlength UV-visible technology (VPT).l: The distance between the tip of the lightdelivering Fibrette Optical Component and the inside bottom of the sample vessel. In this publication, the SoloVPE System demonstrates why the Slope Spectroscopy method is the optimal technique when analyzing nucleic acid purity required for therapeutic delivery systems or raw material in gene therapy applications.). The linear regression coefficient (R2) of the measurement confirms the correlation with Beer’s law. The SoloVPE System requires all measurements have an R2 ≥ 0.999 to be considered valid. Values close to one confirm a strong correlation with Beer’s law by demonstrating that the absorbance values change proportionally with the pathlength values. Therefore, the SoloVPE System can measure wide ranges of concentration without the need of extensive sample preparation and dilution. The SoloVPE System’s variable pathlength technology, fast analysis speed, and enhanced spectral range allow it to produce accurate, linear, and repeatable results [6]Jones-Goldstein DM, Jones M, Haydu S. Determination of plasmid DNA purity ratio in human gene therapy products using slope spectroscopy method. Repligen Corporation 2021 (Feb 22). (Accessed Jun 2022).
In this publication, the SoloVPE System demonstrates why the Slope Spectroscopy method is the optimal technique when analyzing nucleic acid purity required for therapeutic delivery systems or raw material in gene therapy applications.
Materials & Methods
Materials
The materials and consumables used to analyze the DNA purity ratios are listed below. Charles River provided DNA and protein, which were purchased from Thermo Fisher Scientific. The SoloVPE System and associated consumables were provided by Repligen.
Charles River Laboratories
- DNase/RNase free distilled water (Catalog No. 10977015 / Lot No. 2277167)
- Calf thymus DNA (Catalog No. 15633019 / Lot No. 2187506)
- Bovine serum albumin (Catalog No. 23209 / Lot No. WF329717)
Repligen
- SoloVPE instrument (Part No. SYS-VPE-SOLO5)
- Cary 60 UV-Vis spectrophotometer (Part No. IN-CARY 60 or Agilent Part No. G686OA)
- Fibrette Optical Component (Part No. OF0002-P50)
- Plastic vessel–small (Part No. OC0009-1-P50)
- Sample vessel holder–small (Part No. HM0178)
Methods
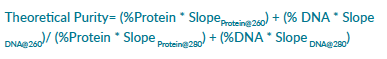
Theoretical DNA purity ratios were analyzed by formulating dilution levels of calf thymus DNA and bovine serum albumin with DNase/RNase-free distilled water. The theoretical purity ratios were calculated by using the average slope of BSA and DNA at 260 nm and 280 nm (from 100% protein and 100% DNA sample readings) and applying the following formula:
Eight purity levels were made, starting with 100% protein, and ending with 100% DNA (Table 1).
| Table 1 Purity ratio levels. | |||||
| Dilution level | % protein | % DNA | Total volume (µl) | BSA (µl) | DNA (µl) |
| 1 | 100.0% | 0.0% | 750.0 | 750.0 | 0.0 |
| 2 | 85.0% | 15.0% | 750.0 | 638.0 | 112.5 |
| 3 | 70.0% | 30.0% | 750.0 | 525.0 | 225.0 |
| 4 | 50.0% | 50.0% | 750.0 | 375.0 | 375.0 |
| 5 | 35.0% | 65.0% | 750.0 | 263.0 | 488.0 |
| 6 | 10.0% | 90.0% | 750.0 | 75.0 | 675.0 |
| 7 | 5.0% | 95.0% | 750.0 | 37.5 | 713.0 |
| 8 | 0.0% | 100.0% | 750.0 | 0.0 | 750.0 |
The SoloVPE System’s small plastic sample vessel was used and required only 120 ul of sample volume. Data was collected in triplicate at each purity level with two analysts during different days.
Results
Specificity
The specificity was assessed by determining if baseline correction was required for all analyses. The need for baseline correction was analyzed by measuring the buffer at 260 nm and 280 nm. Generally, baseline correction is not required if the slope of the buffer is < 0.01 Abs/mm. At slopes this low, the R2 criterion of ≥ 0.999 is not required. This criterion demonstrates if there is any absorbance contribution from the buffer. In this study, the DNase/RNase-free distilled water was measured in triplicate. The average slopes at 260 nm and 280 nm were 0.00106 and 0.00094 Abs/mm respectively. Table 2 demonstrates that the measured slopes are well below 0.01
| Table 2 Observed slope values of the DNase/RNase-free distilled water. The data demonstrates negligible absorbance contribution from the buffer. | |||
| Slope (Abs/mm) | Average slope (Abs/mm) | Slope (Abs/mm) | Average slope (Abs/mm) |
| 260nm | 280nm | ||
| 0.00110 Abs/mm | 0.00106 Abs/mm | 0.00090 Abs/mm | 0.00094 Abs/mm |
| 0.00099 Abs/mm | 0.00104 Abs/mm | ||
| 0.00108 Abs/mm | 0.00080 Abs/mm | ||
Abs/mm, indicating that baseline correction is not required.
Intermediate precision
The intermediate precision was assessed by evaluating the % error of the average observed purity ratios against the theoretical purity ratios. Each purity level was measured in triplicate over the course of four days with two different analysts. For this study to pass, the % error must be ≤ 5.00%. Each triplicate reading demonstrated a % error less than the acceptance criteria of 5.00% as shown in Table 3. The neat protein (level one) and neat DNA (level eight) samples showed the greatest agreement between the expected and observed purity ratios. The results of the intermediate precision study demonstrate that the method is precise.
Repeatability
The repeatability of the system was assessed by evaluating the percent relative standard deviation (%RSD) of all the triplicate reads. The measurements were taken using the same sample, Fibrette Optical Component, and sample vessel. The %RSD is calculated by using the following formula: %RSD = (Standard deviation / average) * 100. For the triplicate reads to be considered repeatable, the %RSD must be ≤ ±2.00%. As shown in Table 3, the %RSD was well below ±2.00% for each triplicate reading.
| Table 3 % Error of the theoretical purity ratios against the average observed purity ratios, and the %RSD for each triplicate measurement. The observed purity ratios correlate very well with the theoretical purity ratios, and the triplicate measurements demonstrate great precision. | ||||||||||||
| Analyst & day | Dilution level | Theoretical purity ratios (Abs/mm) | Observed purity ratio #1 (Abs/mm) | Observed purity ratio #2 (Abs/mm) | Observed purity ratio #3 (Abs/mm) | Average observed purity ratio (Abs/mm) | Expected vs. observed %error #1 (%) | Expected vs. observed %error #2 (%) | Expected vs. observed %error #3 (%) | Expected vs. average observed %error (%) | Standard deviation | % RSD |
| Day 1, analyst 1 | 1 | 0.712 | 0.7112 | 0.713 | 0.7115 | 0.7119 | 0.14% | 0.07% | 0.01% | 0.14% | 0.001 | 0.14% |
| 2 | 1.6043 | 1.6117 | 1.6203 | 1.6213 | 1.6178 | 1.00% | 1.06% | 0.84% | 1.00% | 0.0053 | 0.33% | |
| 3 | 1.7541 | 1.7625 | 1.8026 | 1.7756 | 1.7802 | 2.77% | 1.22% | 1.49% | 2.77% | 0.0205 | 1.15% | |
| 4 | 1.8291 | 1.8571 | 1.8598 | 1.8558 | 1.8576 | 1.68% | 1.46% | 1.56% | 1.68% | 0.0021 | 0.11% | |
| 5 | 1.8577 | 1.8908 | 1.8884 | 1.8972 | 1.8921 | 1.66% | 2.13% | 1.86% | 1.66% | 0.0046 | 0.24% | |
| 6 | 1.8854 | 1.9226 | 1.9373 | 1.9318 | 1.9306 | 2.75% | 2.46% | 2.39% | 2.75% | 0.0074 | 0.38% | |
| 7 | 1.8893 | 1.9184 | 1.915 | 1.9195 | 1.9177 | 1.36% | 1.60% | 1.50% | 1.36% | 0.0023 | 0.12% | |
| 8 | 1.8929 | 1.883 | 1.8992 | 1.8965 | 1.8929 | 0.34% | 0.19% | 0.00% | 0.34% | 0.0087 | 0.46% | |
| Day 2, analyst 1 | 1 | 0.7131 | 0.7145 | 0.7125 | 0.7128 | 0.7133 | 0.19% | 0.08% | 0.05% | 0.02% | 0.001 | 0.15% |
| 2 | 1.5971 | 1.5988 | 1.6013 | 1.594 | 1.598 | 0.11% | 0.26% | 0.20% | 0.06% | 0.0037 | 0.23% | |
| 3 | 1.7516 | 1.7561 | 1.752 | 1.7537 | 1.7539 | 0.26% | 0.02% | 0.12% | 0.13% | 0.0021 | 0.12% | |
| 4 | 1.8296 | 1.8287 | 1.8526 | 1.8446 | 1.842 | 0.05% | 1.25% | 0.82% | 0.67% | 0.0121 | 0.66% | |
| 5 | 1.8595 | 1.8925 | 1.8959 | 1.8981 | 1.8955 | 1.78% | 1.96% | 2.08% | 1.94% | 0.0028 | 0.15% | |
| 6 | 1.8885 | 1.9098 | 1.9229 | 1.9355 | 1.9227 | 1.13% | 1.82% | 2.49% | 1.81% | 0.0129 | 0.67% | |
| 7 | 1.8926 | 1.9266 | 1.9305 | 1.9378 | 1.9316 | 1.79% | 2.00% | 2.39% | 2.06% | 0.0057 | 0.30% | |
| 8 | 1.8963 | 1.8807 | 1.8889 | 1.9199 | 1.8965 | 0.82% | 0.39% | 1.24% | 0.01% | 0.0207 | 1.09% | |
| Day 3, analyst 2 | 1 | 0.705 | 0.7042 | 0.7061 | 0.7048 | 0.705 | 0.11% | 0.16% | 0.04% | 0.00% | 0.001 | 0.14% |
| 2 | 1.6174 | 1.6388 | 1.6335 | 1.6373 | 1.6365 | 1.32% | 0.99% | 1.23% | 1.18% | 0.0027 | 0.16% | |
| 3 | 1.7728 | 1.7905 | 1.7885 | 1.7724 | 1.7838 | 1.00% | 0.89% | 0.02% | 0.62% | 0.0099 | 0.56% | |
| 4 | 1.8508 | 1.8771 | 1.8769 | 1.8684 | 1.8741 | 1.42% | 1.41% | 0.95% | 1.26% | 0.005 | 0.26% | |
| 5 | 1.8806 | 1.9151 | 1.9117 | 1.9209 | 1.9159 | 1.83% | 1.65% | 2.15% | 1.88% | 0.0047 | 0.24% | |
| 6 | 1.9095 | 1.9532 | 1.9713 | 1.9708 | 1.9651 | 2.28% | 3.23% | 3.21% | 2.91% | 0.0103 | 0.53% | |
| 7 | 1.9136 | 1.9918 | 1.9794 | 1.9613 | 1.9775 | 4.09% | 3.44% | 2.49% | 3.34% | 0.0154 | 0.78% | |
| 8 | 1.9173 | 1.9064 | 1.9211 | 1.9246 | 1.9173 | 0.57% | 0.20% | 0.38% | 0.00% | 0.0097 | 0.51% | |
| Day 4, analyst 2 | 1 | 0.7116 | 0.712 | 0.7115 | 0.7112 | 0.7115 | 0.06% | 0.01% | 0.05% | 0.00% | 0.0004 | 0.05% |
| 2 | 1.6293 | 1.6492 | 1.6425 | 1.6457 | 1.6458 | 1.22% | 0.82% | 1.01% | 1.02% | 0.0033 | 0.20% | |
| 3 | 1.7891 | 1.8087 | 1.8012 | 1.7997 | 1.8032 | 1.10% | 0.68% | 0.60% | 0.79% | 0.0048 | 0.27% | |
| 4 | 1.8697 | 1.8956 | 1.9 | 1.9026 | 1.8994 | 1.38% | 1.62% | 1.76% | 1.59% | 0.0036 | 0.19% | |
| 5 | 1.9005 | 1.9267 | 1.933 | 1.9283 | 1.9293 | 1.37% | 1.71% | 1.46% | 1.51% | 0.0033 | 0.17% | |
| 6 | 1.9306 | 1.9912 | 1.998 | 1.9911 | 1.9934 | 3.14% | 3.49% | 3.13% | 3.26% | 0.004 | 0.20% | |
| 7 | 1.9348 | 1.9648 | 1.9842 | 1.9806 | 1.9765 | 1.55% | 2.56% | 2.37% | 2.16% | 0.0104 | 0.52% | |
| 8 | 1.9386 | 1.9275 | 1.9546 | 1.9339 | 1.9387 | 0.58% | 0.83% | 0.24% | 0.00% | 0.0142 | 0.73% | |
Linearity
The linearity was assessed by analyzing the average R2 of each triplicate reading (Table 4). The R2 must be ≥ 0.999 for the measurement to be considered valid and linear. As demonstrated in Table 4, the average R2 was well above 0.999 at each purity level during different days and with two analysts.
| Table 4 Average R2 at 260 nm and 280 nm of each purity level. The measurements demonstrate great linear correlation with Beer’s law. | ||||||||
| Dilution level | Day 1, analyst 1 | Day 2, analyst 1 | Day 3, analyst 2 | Day 4, analyst 2 | ||||
| R2260 | R2280 | R2260 | R2280 | R2260 | R2280 | R2260 | R2280 | |
| 1 | 0.9999 | 1.0000 | 1.0000 | 1.0000 | 1.0000 | 1.0000 | 1.0000 | 1.0000 |
| 2 | 1.0000 | 0.9999 | 1.0000 | 0.9999 | 1.0000 | 0.9999 | 1.0000 | 1.0000 |
| 3 | 1.0000 | 1.0000 | 1.0000 | 1.0000 | 1.0000 | 1.0000 | 1.0000 | 1.0000 |
| 4 | 1.0000 | 0.9999 | 1.0000 | 1.0000 | 1.0000 | 0.9999 | 1.0000 | 0.9999 |
| 5 | 1.0000 | 0.9999 | 1.0000 | 0.9999 | 1.0000 | 0.9999 | 1.0000 | 0.9999 |
| 6 | 1.0000 | 0.9999 | 1.0000 | 0.9999 | 1.0000 | 0.9999 | 1.0000 | 0.9999 |
| 7 | 0.9999 | 0.9999 | 1.0000 | 0.9999 | 0.9999 | 0.9999 | 1.0000 | 0.9999 |
| 8 | 1.0000 | 0.9999 | 1.0000 | 0.9999 | 1.0000 | 0.9999 | 0.9999 | 0.9999 |
Additionally, the linear regression of the dilution series was analyzed by plotting the theoretical purity ratios against the average observed purity ratios. Figure 2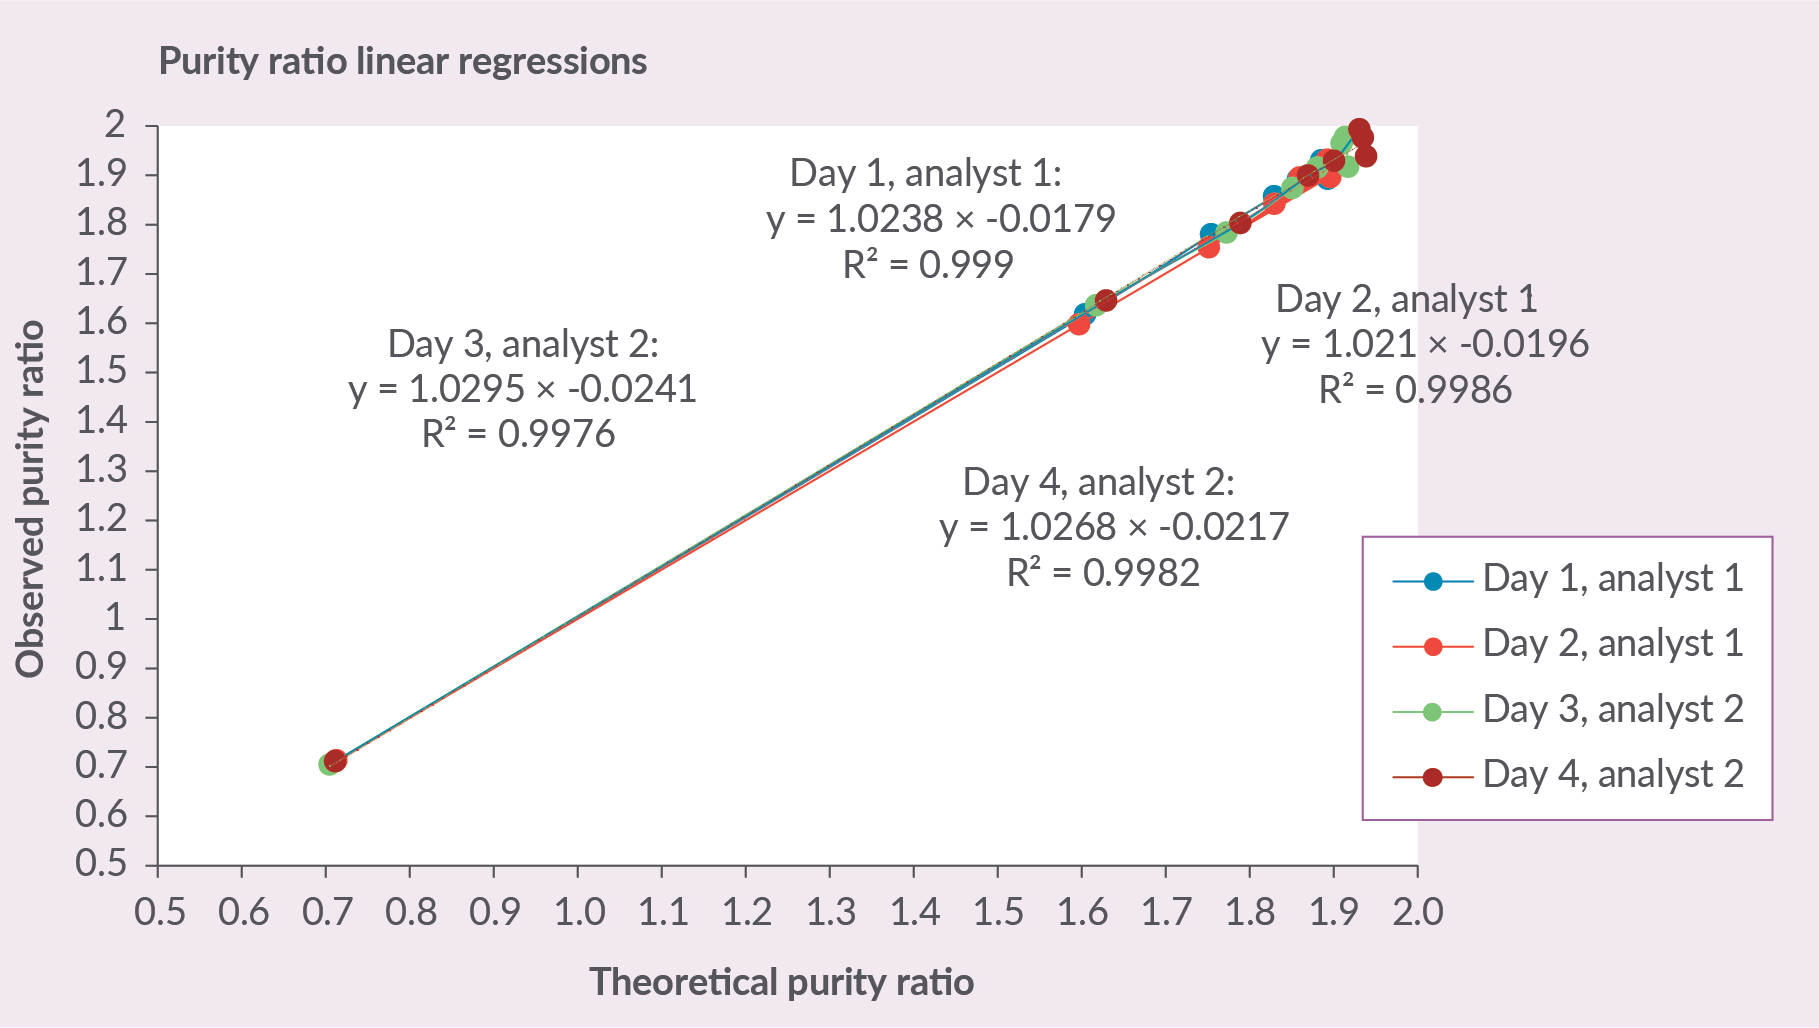 Linear regressions of the theoretical purity ratios against the observed purity ratios. The figure demonstrates great linear correlation between the datasets. demonstrates each of the linear regressions. The analysis that was performed on day 1 with analyst 1 showed the best linear correlation with an R2 of 0.999 (Figure 2). The results of the linear regression analysis show that the method is found to be linear.
Accuracy
Accuracy of the DNA purity method was inferred from the linearity, repeatability, and intermediate precision. The acceptance criteria for each of the studies was met. As a result, the Slope Spectroscopy method is considered accurate for determining DNA purity ratios.
Discussion
The specificity was the first study to be performed to determine if baseline correction was required for subsequent analyses. The results of the buffer demonstrated that the DNase/RNase-free distilled water had little to no absorbance, meaning there is no interference from the buffer on the absorbance of the DNA.
The intermediate precision study demonstrated strong correlation between the theoretical purity ratios and the average observed purity ratios. Even with testing over the course of 4 different days and two different analysts, the SoloVPE System was able to demonstrate reproducible results. The highest percent error that was measured on each day was 2.77%, 2.06%, 3.34%, and 3.26%, demonstrating that the SoloVPE System was able to accurately determine the theoretical purity ratios. Additionally, the majority of those measurements that exhibited a higher percent error could be related to dilution error.
Furthermore, the repeatability study demonstrated that the SoloVPE method is repeatable. All triplicate readings at each purity level resulted in %RSD values much lower than 2.00%. With the exception of one purity level, all triplicate readings were under 1%, demonstrating the SoloVPE System’s ability to produce repeatable results. Moreover, the linearity study demonstrated that the measurements were correlating well with Beer’s law. Each measurement at 260 nm and 280 nm demonstrated an R2 ≥ 0.999. The theoretical purity ratios also showed great linear correlation against the average observed purity ratios. Almost all measurements achieved an R2 of 0.999, with the lowest R2 being 0.9976 (Figure 2). All studies indicate that the SoloVPE method is accurate to support DNA purity ratio determination.
Throughout the study, it was interesting to see that the purity level decreases after the 90% DNA solution. Theoretically, the 100% DNA should have the highest purity ratio; however, this phenomenon happens consistently for each measurement and is independent of the rep, analyst, and day. It is difficult to pinpoint the exact reasoning for this; however, the slope of the 100% DNA at 280 nm was consistently the highest. Therefore, either the > 90% DNA is so concentrated that the protein absorbance is increasing, thus lowering the ratio, or there is a lack of protein absorbance contributing to the DNA at these high levels, which would also lower the ratio. Overall, all purity ratios were well above their acceptance criteria. Additional testing is required to come to an accurate conclusion.
The SoloVPE is a convenient tool to carryout DNA purity studies. It does not require sample dilution which helps save time. Traditional UV-Vis spectroscopy requires background correction, however for the SoloVPE System, if the media demonstrates a slope lower than 0.01 Abs/mm, background correction is not essential. For concentration calculations (DNA and proteins), merely entering the extinction coefficient and wavelength will produce the results. The user result section makes it easy to carry out other calculations using the SoloVPE System, which are generated along with the data, thus barring the need to use excel sheets and validating them.
Conclusion
This publication demonstrates the SoloVPE System as the preferred method of DNA purity determination. Regarding this application, the Slope Spectroscopy method allows the SoloVPE System to overcome the issues that are seen with traditional spectrophotometers. The SoloVPE System passed all acceptance criteria, concluding that the method is specific, precise, repeatable, linear, and accurate. The SoloVPE System has proven to be a reliable analytical method to support DNA purity determination.
References
1. Huss VAR, Festl, H, Schleifer KH. Studies on the spectrophotometric determination of DNA hybridization from renaturation rates. Syst. Appl. Microbiol. 1983; 4(2), 184–192. Crossref
2. Glasel JA. Validity of nucleic acid purities monitored by 260nm/280nm absorbance ratios. Biotechniques 1995; 18(1), 62–63. Crossref
3. Sambrook JF, Russell. DW. Molecular Cloning: A Laboratory Manual (3rd ed.). 2001, Cold Spring Harbor Laboratory Press. Crossref
4. Nucleic Acid Quantitation - an overview | ScienceDirect Topics. ScienceDirect. (Accessed Jun 2022) Crossref
5. Matlock B. Assessment of Nucleic Acid Purity. Thermo Scientific 2015. (Accessed Jun 2022) Crossref
6. Jones-Goldstein DM, Jones M, Haydu S. Determination of plasmid DNA purity ratio in human gene therapy products using slope spectroscopy method. Repligen Corporation 2021 (Feb 22). (Accessed Jun 2022) Crossref
Affiliations
Nigel Herbert
Senior Bioanalytics Applications Specialist,
Repligen Corporation
Drusha Purohit
Scientist I, Analytical – Compendial Group,
Charles River Laboratories
Hannah Mignault
Team Lead, Analytical – Compendial Group,
Charles River Laboratories

Authorship & Conflict of Interest
Contributions: All named authors take responsibility for the integrity of the work as a whole, and have given their approval for this version to be published.
Acknowledgements: The authors would like to acknowledge Joe Ferraiolo, At-Line Applications Director, Bioprocess Analytics, Repligen Corporation and Scott Stone, Senior Scientist, Analytical Services, Charles River Laboratories
Disclosure and potential conflicts of interest: Nigel Herbert discloses that virtual meetings were conducted with Charles River Labs. Drusha Purohit discloses data was provided and reviewed by Charles River Labs and it was written by Repligen. Drusha Purohit and Hannah Mignault disclose virtual meetings were conducted between Charles River Labs and Repligen. The authors have no other conflicts of interest.
Funding declaration: The authors received no financial support for the research, authorship and/or publication of this article.
Article & copyright information
Copyright: Published by Cell and Gene Therapy Insights under Creative Commons License Deed CC BY NC ND 4.0 which allows anyone to copy, distribute, and transmit the article provided it is properly attributed in the manner specified below. No commercial use without permission.
Attribution: Copyright © 2022 Repligen. Published by Cell and Gene Therapy Insights under Creative Commons License Deed CC BY NC ND 4.0.
Article source: Invited; externally peer reviewed.
Submitted for peer review: Jul 28 2022; Revised manuscript received: Aug 24 2022; Publication date: Sep 14 2022.