
A case study on streamlining AAV titer determination using variable pathlength technology
Cell & Gene Therapy Insights 2022; 8(9), 1099–1111
DOI: 10.18609/cgti.2022.164
Today, one of the primary challenges in manufacturing recombinant adeno-associated virus (rAAV) of consistent quality remains the fact that current analytical tools are insufficient to meet all needs. This is due to their high variability (CV 20–40%), low sample throughput, and long turnaround times. Furthermore, process development can be time-consuming, especially in that many development cycles are required to achieve robust and consistent comparability between development lots. Variable pathlength technology (VPT) provides a new method for AAV titer determination using real-time monitoring, which eliminates the dependency on off-line testing and associated variability caused by sample manipulation. In this article, we will demonstrate how at-line process controls, using VPT, can offer quick and direct total viral vector analysis during development to enhance throughput and improve decision- making. The implementation of the SoloVPE System and FlowVPX System technology for AAV viral titer concentration will be explored.
Introduction to variable pathlength technology & slope spectroscopy
Slope spectroscopy is an analytical technique that could be used when a quick, comparable result is required at any stage of the purification process, in order to give confidence in the titer at that stage and allow for continued processing. Slope spectroscopy has been used in biologic manufacturing for over a decade. Common applications include plasmid concentration and purity, DNA concentration and purity, virus titer, ultrafiltration/diafiltration (UF/DF) monitoring, and empty/full capsid testing. The SoloVPE and FlowVPX Systems are designed to ensure that the integrity of the method is followed all the way through each process step.
The SoloVPE System does not rely on a fixed path length to make any sample measurement ( Figure 1 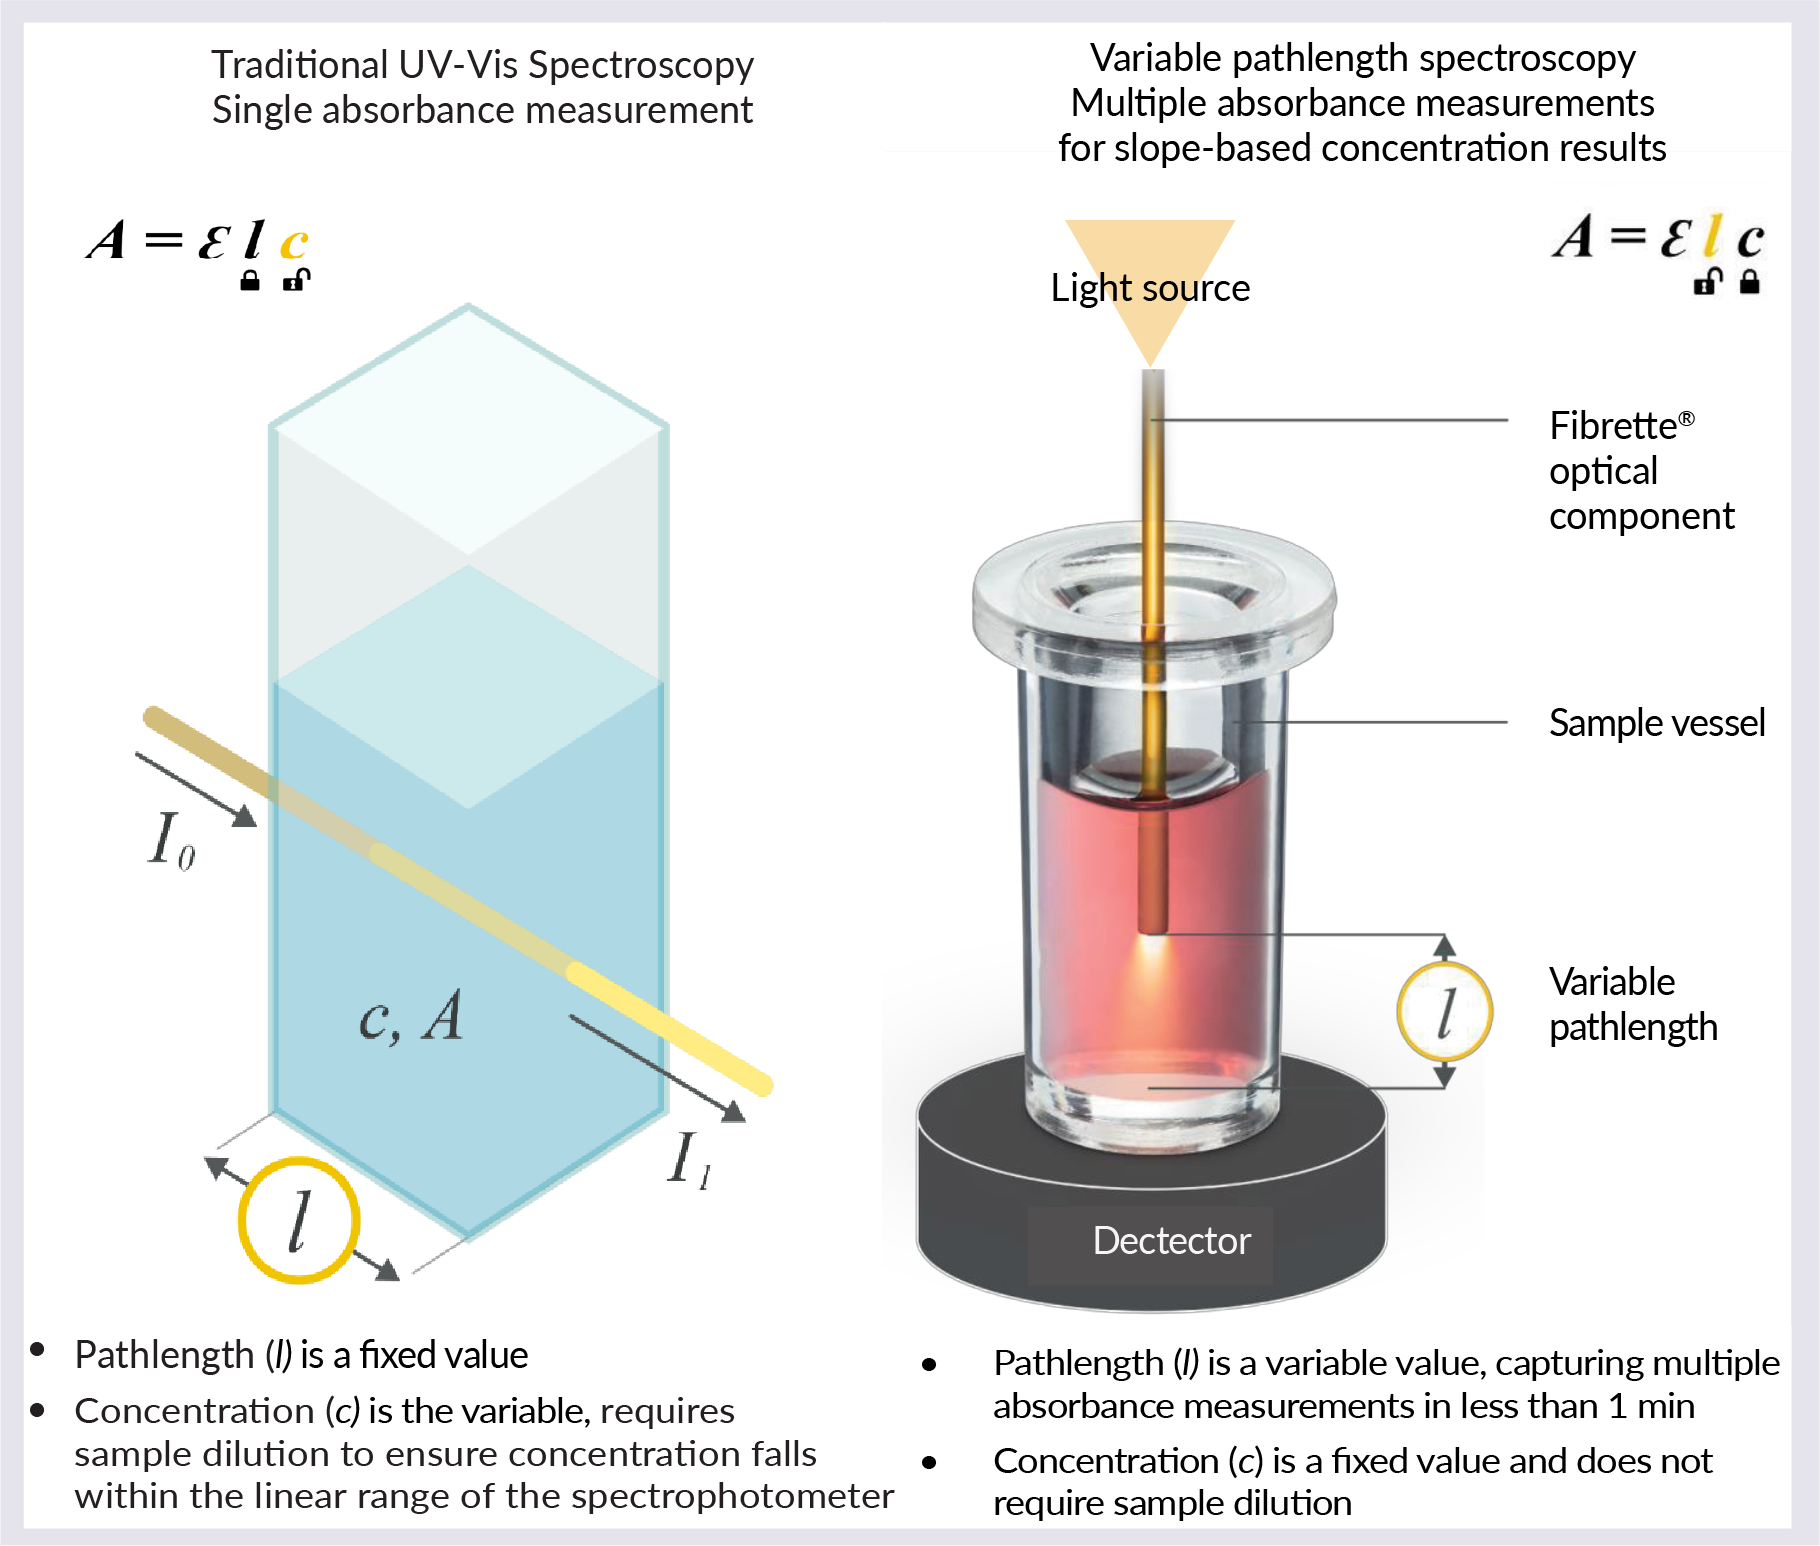 Traditional UV spectroscopy versus variable pathlength spectroscopy. ). The pathlength is a variable value, capturing multiple absorbance measurements in under 1 min. The concentration is a fixed value and does not require sample dilution, as with traditional UV-Vis spectroscopy.
The SoloVPE and FlowVPX Systems guarantee linear results based on an R2 value of 0.999 or higher. To collect the data, the fully automated equipment will lower to set zero pathlength, and an algorithm will find 1 Au. The equipment will then collect data for up to 10 different pathlengths in order to calculate the slope regression. Pathlength ranges from 5 µm to 15 mm, in steps as small as 5 µm.
Viper AAV application software
The Viper AAV application software has evolved as an automated solution specifically designed to calculate AAV viral titer. For data collection, wavelengths for the DNA and the protein need to be established. There are four extinction coefficients required to calculate the viral titer concentration. The user would be responsible for inputting the extinction coefficient for the 260 DNA. This would come from the molecular weight, or by inputting the DNA sequence directly into the software to calculate the extinction coefficient. The test results will then be on-screen within one minute. There is also a sequence input for determining extinction coefficients using a DNA sequence.
Downstream AAV process development: PTC Therapeutics case study
Introduction
The PTC Therapeutics Gene Therapy Technical Center of Excellence has integrated space for process development, testing, and GMP manufacture of both plasmid DNA and AAV products. PTC has a diversified platform for research with a portfolio of six commercial products: five small molecule medicines and one gene therapy product, UpstazaTM (eladocagene exuparvovec).
Upstaza is an AAV2-based gene therapy for the treatment of aromatic L-amino acid decarboxylase (AADC) deficiency, approved by the European Medicines Agency (EMA) in July 2022. As well as bringing a much-needed treatment to patients in need, this product marks the fourth in vivo gene therapy product to gain approval in the US or Europe, highlighting its importance to the industry as a whole. There are further gene therapy candidates in the PTC Therapeutic pipeline.
Typical AAV purification process flow
When AAV is produced on an industrial scale in the upstream cell culture, it goes through a cell lysis and clarification step, followed by capture chromatography (utilizing either affinity chromatography or ion exchange (IEX) chromatography). Following a capture step, the vector product will go through a polishing step to separate full from empty capsids with either IEX chromatography or another method. After the polishing step, the purified AAV goes through a UF/DF step before final formulation and fill-finish.
The goal of the process development team is to deliver a robust and scalable purification process to produce the AAV in an effective form. Ensuring specifications of critical quality attributes (CQAs) are met for all process parameters is important. Key CQAs include AAV genome titer, capsid titer, and full-empty capsid ratio.
Currently, PTC’s in-house AAV quantification methods include quantitative PCR (qPCR)/droplet digital PCR (ddPCR) for genome titer determination, and capsid enzyme-linked immunosorbent assay (ELISA) for capsid titer determination. These are industry standard testing methods, but they come with the drawback of up to a 2-week turnaround time and a backlog for the testing lab.
SoloVPE System evaluation
PTC Therapeutics have collaborated with Repligen to evaluate the CTech SoloVPE System as an interim analytical method for quick and simple AAV titer measurement. The system provides a direct measurement in less than 5 mins per sample.
The Repligen team worked onsite to help PTC Therapeutics set up the method and measure some in-process samples, including affinity elution, polishing elution, and some intermediates from the tangential flow filtration step. During the initial assessment, the genome titer and capsid titer were measured using the SoloVPE System and those values were compared to genome titer obtained by qPCR and capsid titer by capsid ELISA. The log10 difference was 7.4% for SoloVPE System versus qPCR, and less than 4% versus the ELISA method. The initial assessment revealed that the SoloVPE System data showed good comparability with the qPCR and capsid ELISA data.
To assess the accuracy of the SoloVPE System, more in-process samples from downstream process development were measured, and the genome titer and capsid titer using a SoloVPE System was compared to data collected using the qPCR and ELISA methods ( Figure 2 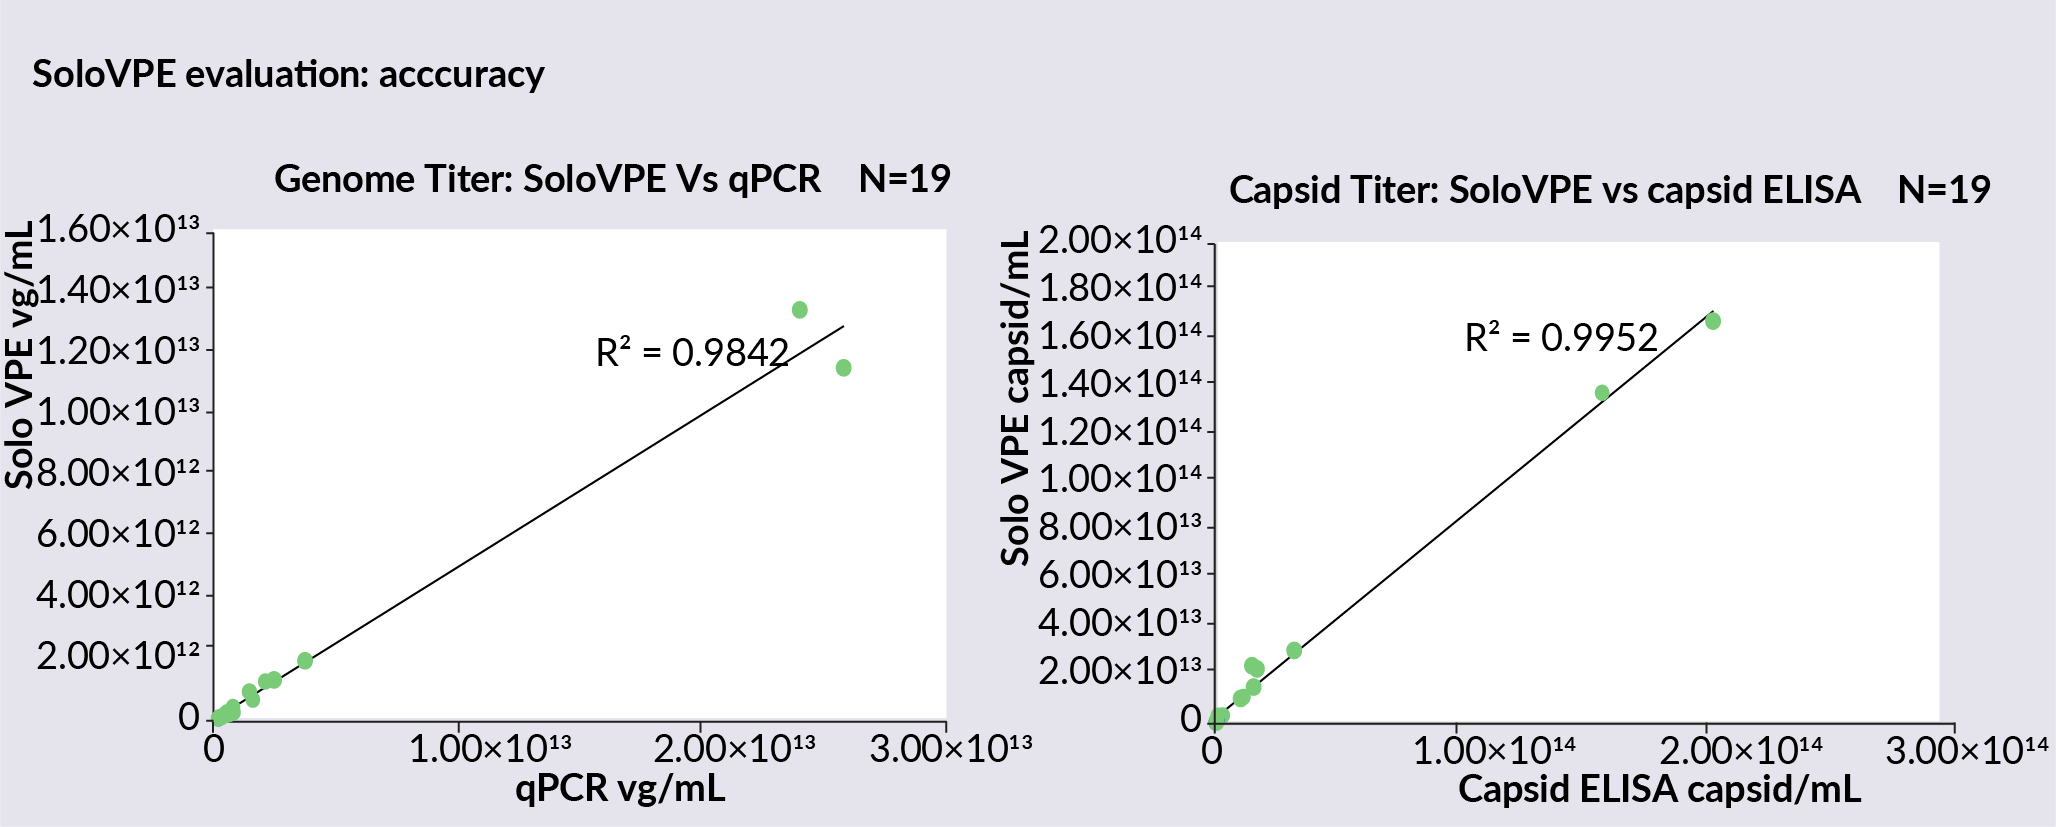 Genome titer data collected on the SoloVPE System versus qPCR and capsid ELISA to assess accuracy. ). Titer data from SoloVPE System shows excellent comparability with qPCR data in a linear trend, with an R2 of 0.9842. Capsid titer also showed a greater linear comparability between the SoloVPE System data and the capsid ELISA data, with an R2 value of 0.9952.
The linearity of the SoloVPE System was then assessed ( Figure 3 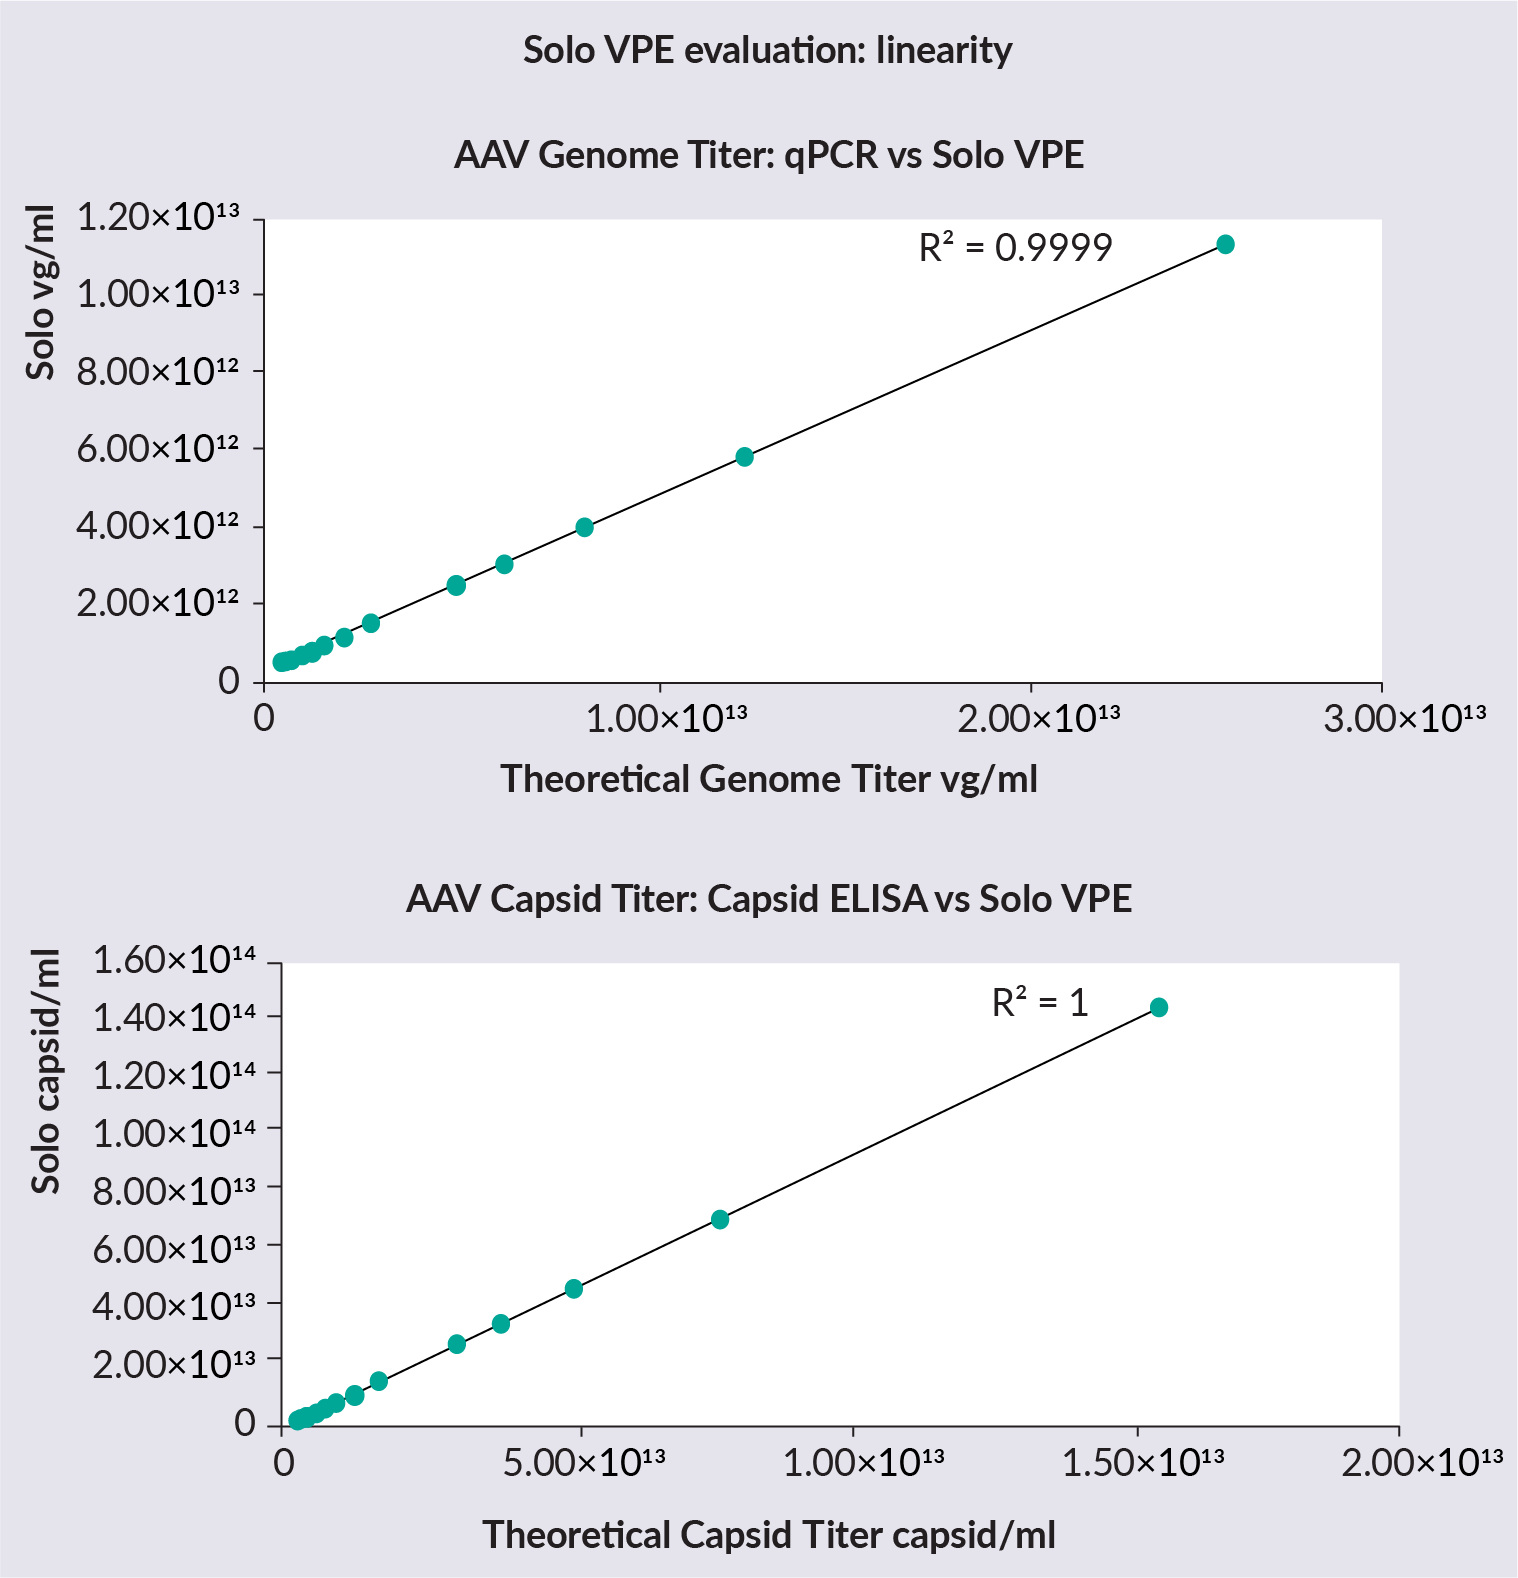 Genome titer data collected on the SoloVPE System versus qPCR and capsid ELISA to assess linearity. ). A concentrated AAV sample was diluted to 12 various concentrations. SoloVPE System data shows an excellent correlation with expected qPCR and capsid ELISA values from the dilutions. The concentration range tested was 4.7×10¹¹– 2.6×10¹³vg/mL for qPCR, and 2.9×10¹²– 1.6×10¹⁴ capsid/mL for capsid ELISA.
Next, the repeatability of the SoloVPE System was assessed. The AAV samples were measured in triplicate, using the same Fibrette™ and the same aliquoted sample within the sample vessel. The %RSD (relative standard deviation) is less than 2% for both the slope 260 and slope 280 measurements.
The intermediate precision of the SoloVPE System was also analyzed. The AAV sample was measured by two scientists on different days using different Fibrettes, sample vessels, and aliquots. The slope 260 and slope 280 values again had a small RSD of less than 1%.
After establishing the accuracy, linearity, repeatability, and the intermediate position of the SoloVPE System-, the potential applications in AAV downstream process development were assessed.
Figure 4 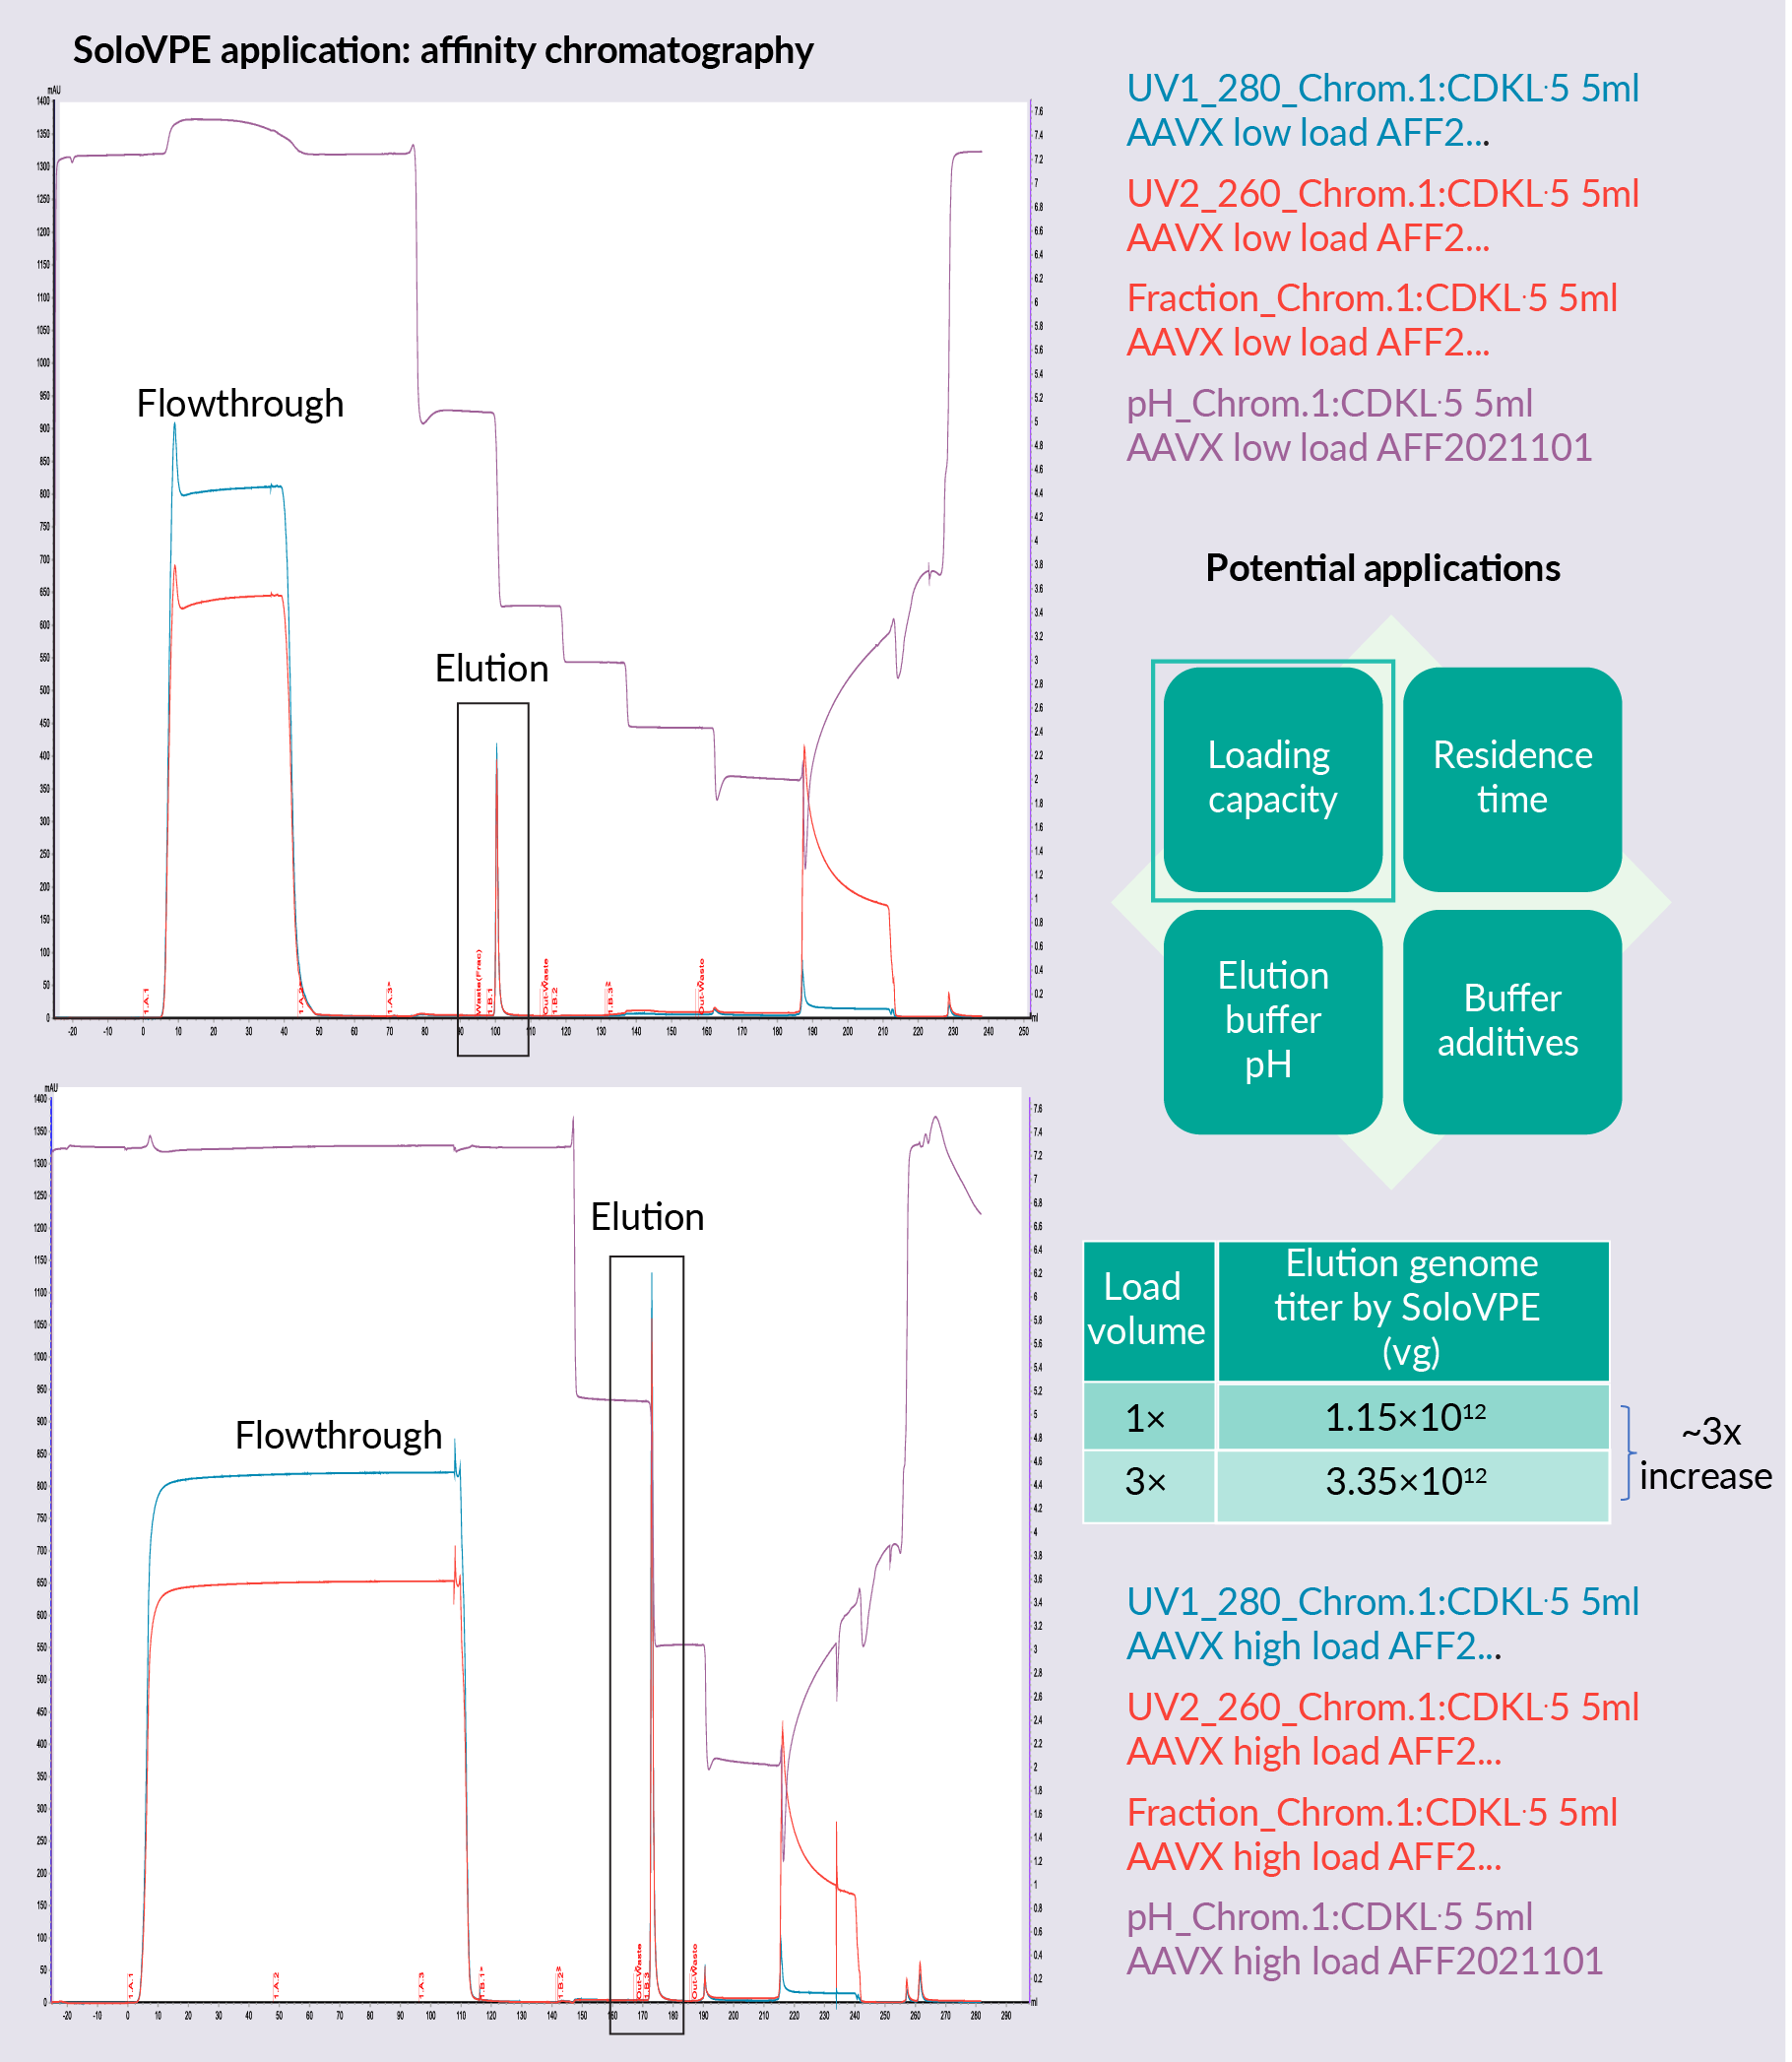 Affinity chromatography development using the SoloVPE System shows a loading capacity study for affinity chromatography. SoloVPE System technology was used to estimate genome titer recovered in the elution and demonstrated that three times the loading volume leads to around three times the genome titer in the elution pool. The maximum loading capacity of this column has not yet been reached with this higher loading.
Alternative potential applications in affinity chromatography for the SoloVPE System include residence time studies, buffer additive studies, and elution buffer pH studies. SoloVPE can also be used in polishing chromatography. SoloVPE vector titer and full capsid percentage measurement allow quick decision making in AAV polishing step process development based on recovery and full capsid enrichment, to decide which buffer condition is ideal for each purpose.
Other potential applications for the usage of SoloVPE in the polishing step include resin screening, buffer additive screening, loading capacity, residence time, loading pH/conductivity, elution buffer pH conductivity, and gradient/step elution studies.
The SoloVPE System can also be applied in the UF/DF process. In this step, the purified AAV is concentrated before buffer exchange and formulation. It is important to have in-process control for this step to ensure accurate concentration. Monitoring the product titer during the process reduces the chance of unexpected product loss.
An experiment to measure the genome titer using the SoloVPE System for the starting material and three other samples either during the concentration step or the final product was conducted. Concentration factor was calculated using the SoloVPE System, and it was in good agreement with calculations from volume reduction. This shows that the SoloVPE System can be used as a novel UF/DF in-process control method.
Q&A


Joe Ferraiolo & Yan Chen
How comparable are the results from the SoloVPE System compared to the industry standard?
JF: There are two industry standards: qPCR and ELISA, or ddPCR and ELISA.
When we were comparing the slope spectroscopy technique to any of the other methods being used, the results always lie within the tolerance of that method, which is unfortunately quite high – from ± 20 to 40%. The only thing we can absolutely guarantee is that our method will be faster, more repeatable, and more linear. It remains a challenge to assess accuracy related to any type of gold standard. Yan and I are still curious to explore whether there is a more accurate technique.
How accurate do the extinction coefficient and the finishing coefficient need to be? Is it acceptable to use theoretical values?
YC: If your AAV is wild-type, you can use an already published AAV extinction coefficient, because all wild-type AAVs have capsids that are highly conserved. The difference in extinction coefficients between different serotypes can be less than 5%.
For novel AAV serotypes that are completely different from existing ones, if you know the protein sequence, online tools can be used to calculate AAV extinction coefficients. The calculation of the titer is dependent on the coefficient used.
Have you ever used this method to measure titers in affinity chromatography? Could you use this method to measure titer in clarified harvest, for example?
YC: We have not used the SoloVPE System to measure AAV titer in the harvest, because the SoloVPE System is an A260 and A280 absorbance-based UV method that does not measure any signal given by host cell protein or DNA. It cannot distinguish where the signal comes from. In the crude cell culture harvest, there is a lot of host cell protein and DNA that can interfere with the accuracy of the results. I would not use the SoloVPE System to measure the AAV titer in the crude cell culture harvest.
JF: It can be used after chromatography. The technique is also unable to tell the difference between partial DNA or DNA. This is not specific to SoloVPE System or slope spectroscopy, incidentally–it is a UV issue.
What is the minimum sample volume needed to give reliable data?
JF: The sample volume needed is between 60–100 µL. However, slope spectroscopy is not a destructive technology, so you retain your sample after the measurement.
What is the success of this technique for in-process samples, where impurity levels could be significant, versus purified vectors?
YC: If you use this technique after the affinity step, for measuring an affinity-purified sample or an even further purified polishing sample, the impurity levels should be minimal, and the SoloVPE System will be accurate if you do run-to-run comparisons.
However, if you capture your AAV using IEX chromatography, you may have significant impurities and the reading may not be very accurate. It depends on your method of purification and which in-process sample you measure.
For 260 nm extinction coefficient, is the value required for full capsid with DNA in it, or only DNA? What extinction coefficient values need to be inputted into the software?
JF: That is the extinction coefficient at 260 for the DNA. It is the only value that we do not pre-populate in the software for the calculation, as it changes depending on the product that you are testing.
We have the calculator tool built into the software for you to add your sequence to calculate that value for a more accurate result. We did find that the other wavelengths for the protein did not change significantly, even when different concentrations or different serotypes were tested.
We are looking at other viruses. However, in order for a UV method to work, you need extinction coefficients. There are no currently published extinction coefficients for lentivirus, for example, although we can certainly make the measurement based on the information you can provide.
Is the capsid titer AAV-specific or intact capsid-specific?
YC: It depends on the extinction coefficient you use for the capsid or the specific AAV you are using. If you are working with a traditional wild-type AAV, it should not be AAV-specific. If you are working with a normal capsid with a different protein sequence and extinction coefficient, then the AAV can differ a lot from the traditional AAVs that might be capsid-dependent or specific.
Has the SoloVPE System’s linearity been verified for genome titers below 4.7-11 vg/mL?
JF: Yes, it has. We have gone as low as 2.0×10⁻¹¹. We would go no lower with the current technology. Higher is never an issue, as there is plenty of linear range.
Realistically, anything below 1011 will not allow the acquisition of robust linear data, as the signal is too weak and there is no representative change of absorbance over pathlength. We cannot guarantee the accuracy of the measurement once we get below 10 -11.
Can the SoloVPE System be used for samples with completely unknown titer values?
JF: If you are walking up to the system with a blind sample, we can provide a ratio (R) value. However, if you need to calculate vg/mL, then you need your DNA sequence available.
However, a few of our customers are looking at making decisions for multiple lots of material based only on the R value. If they are looking at formulation, I will make up a number of different batches of material, and then, based on the R value alone, they will pool lots together of similar R values and then send that larger lot out for analysis. The goal is that rather than paying and waiting for ten lots, you might only have to send two or three lots out, depending on how closely aligned your R values are.
How would you find the extinction coefficient for AAV?
JF: We are using existing publications. Sommer’s paper is our primary source for three out of the four extinction coefficients that we use. For the second one, we are going to rely on you to provide your molecular weight or DNA sequence.
Is the SoloVPE System and software fully GMP compliant? How are the system and software qualified, and what type of support is provided for qualification?
JF: Our primary business is in the GMP environment. We always plan for the future. All of our applications using slope spectroscopy have the capability of the software being 21 CFR part 11 compliant.
We offer software validation services and work with users to ensure their specific needs are met by IT groups so we can give a tailored configuration for software setup, and also ensure that we are compliant with regulations.
How long does it normally take for the SoloVPE System to be installed and validated for process development work?
JF: Repligen will not be the bottleneck in this. Most of the time spent during validation is waiting for our customers to schedule the installation and the training. Typically, the more access we have to work with the scientists, the quicker this happens. Most method development and validation is typically done within 6–12 months. However, there have been cases where we have dramatically improved those timeframes, depending on how much access we have to work with the client and their current project demands.
What is the validation process and what validation support does Repligen provide?
JF: Our application specialists have all been trained to work directly with the scientists in helping develop a robust method for whatever application you are working with, and a system that the design of experiments and standard operation procedures would follow in releasing the method for use in the lab.
Our involvement is not just basic user training. We assist with the heavy lifting that is required to define parameters for method development, and then help to successfully implement the tests to validate the methods for release.
Can the SoloVPE System be used to test incoming plasmid product as raw material to check purity level?
JF: As long as the material is purified, the answer is yes. The serotype does not make a difference. Traditionally we are looking at a range of slope from 1.8 to 2.0. We have papers and publications on our website noting this.
What are the limitations of the SoloVPE System for AAV titer measurements?
YC: Since the SoloVPE System is UV-based method, anything that can interfere with the absorbance at 260 and 280 nm may potentially affect the accuracy of the result. Excipients can interfere with the absorbance, as can high levels of impurities, including host-cell protein and nucleic acid in your sample. These factors will affect the accuracy of results from the SoloVPE System reading.
Secondly, it does not distinguish full capsids from partial capsids, as it does not distinguish specific DNA sequences.
Can the SoloVPE System replace current standard AAV titer assays?
YC: The question of whether you can use the SoloVPE System to replace the current standard AAV titer assay is dependent on each company’s needs and its own method of evaluation and validation.
In certain instances, such as for the in-process control of the final UF/DF step, it has great potential to replace traditional assays, due to its speed and accuracy. For other steps, it depends on each company’s needs and validation. We are not looking to replace other standard assays during normal inclusive sample testing. We will use the SoloVPE System as a complementary method for run-to-run comparisons during process development to speed up our development timeline.
What does the R value in the Viper software measure, and what can you use that measurement for?
YC: The R value is the ratio between the slope 260 and slope 280 from the Solo VPE reading. This value can be used to estimate the full capsid percentage in the AAV process sample you just measured. Using the equation provided in the Sommer paper, you can use this R value to get a rough estimate of the full capsid percentage in your sample.
While comparing and evaluating the empty capsids of AAV with respect to the virulent form, does the optical density measurement give values that would differ as per the variant and gene of interest (GOI) in terms of extinction coefficient, or those of slope spectroscopy values?
JF: We have not seen differences, primarily because the DNA contribution is the star in the ratio measurement. The protein wavelengths have a slope and there is a contribution from the capsid, but in comparison to the DNA, we have not seen a significant change. The values do not necessarily change on a scale that is going to make a significant difference to the results. We see a 2–5% difference depending on the entire range of concentrations, which does not impact the sample very much.
Does this titer analysis require the use of the Viper software, or can it be performed with the legacy software from C Technologies?
JF: Our Viper platform software is our next-generation software. Both pieces of software can technically be utilized - however, the older version of the software makes getting results more cumbersome and challenging for scientists, due to a lack of automation.
The new platform can collect all your data and the software can perform all calculations for you in under a minute. That would not be possible with the older versions of the software.
Does the method need to be qualified for in-process samples?
YC: Personally, we did not qualify the method for in-process sample measurement, because we are using it for run-to-run comparison. However. this does depend on the needs of each company.
Biographies
Joe Ferraiolo leads the bioanalytics applications team and is in charge of the SoloVPE variable pathlength spectroscopy system for at-line applications. He has been with the company for more than 20 years, with over ten years of development and validation experience in analytical applications. He specializes in UV analysis and leads the development and commercialization of high-value products and flexible solutions that address critical steps in the production of biologics.
Yan Chen is a principal scientist in Downstream Process Development- Gene Therapy at PTC Therapeutics. He has more than 14 years of experience in the biologics field. Yan has worked at several biotech and pharmaceutical companies and developed purification processes for biologics, including mAbs, recombinant proteins, and viral vectors. His expertise includes downstream process development for early and late stage programs, technology transfer, and process characterization. He received his PhD in Cell Biology from New York University.
Affiliations
Joe Ferraiolo
Director, At-line Bioanalytic Applications,
Repligen
Yan Chen
Principal Scientist,
Downstream Process Development, Gene Therapy,
PTC Therapeutics

Authorship & Conflict of Interest
Contributions: All named authors take responsibility for the integrity of the work as a whole, and have given their approval for this version to be published.
Acknowledgements: None.
Disclosure and potential conflicts of interest: Yan Chen discloses he has stock options at PTC Theraputics. Joe Ferraiolo has no conflicts of interest.
Funding declaration: Yan Chen received financial support for the research, authorship and/or publication of this article from PTC Theraputics.
Article & copyright information
Copyright: Published by Cell and Gene Therapy Insights under Creative Commons License Deed CC BY NC ND 4.0 which allows anyone to copy, distribute, and transmit the article provided it is properly attributed in the manner specified below. No commercial use without permission.
Attribution: Copyright © 2022 Repligen Corporation. Published by Cell and Gene Therapy Insights under Creative Commons License Deed CC BY NC ND 4.0.
Article source: This article is based on a Webinar which can be found here.
Webinar conducted on: Aug 10 2022; Revised manuscript received: Sep 19 2022; Publication date: Oct 13 2022.