Can novel bioreactors improve the cost of goods of viral vectors?
Cell & Gene Therapy Insights 2023; 9(5), 687–704
DOI: 10.18609/cgti.2023.087
Lentiviral and adeno-associated viral vectors make up the vast majority of gene therapy candidates for in-vivo and in-vitro applications. While effective for treating a range of debilitating diseases, they are also currently very expensive to produce, which hampers patient accessibility. While other biologics have been studied and optimized for several decades, viral vectors still suffer from relatively low titers, difficulty in scaling up and poor downstream recovery. A review of available technologies focusing on upstream solutions highlights that despite the development of randomly packed bed bioreactors for adherent cells and the move to suspension cell cultures in stirred tank bioreactors, technology design flaws hamper efforts to cost-effectively bring new therapies to the market. In this paper, the scale-X™ and NevoLine™ technologies are shown to provide conditions that support two to ten-fold increase in cell specific productivity for AAV and LVV relative to alternative technologies, which results in drug substance cost of goods reduction between −18% and −61%. Furthermore, increased titers, smaller footprint and reduced complexity could improve the efficacy of facility utilization.
AAVs & LVVs will likely dominate the clinical & commercial landscape for years
The cell and gene therapy field is one of the fastest growing fields in biopharmacy as it offers the potential to treat diseases that, up until now, had no cure. Together, Adeno-Associated viruses (AAVs) and Lentiviruses (LVVs) make up the vast majority of both marketed drugs and clinical candidates. Out of 489 known clinical trials covering both cell & gene therapies, a substantial 74% (364) are using either AAV (129) or LVVs (235) [1]Alliance for Regenerative Medicine. Regenerative Medicine: The Pipeline Momentum Builds. Alliance for Regenerative Medicine, 2022Alliance for Regenerative Medicine. Regenerative Medicine: The Pipeline Momentum Builds. Alliance for Regenerative Medicine, 2022. At the time of writing, 5 AAV (Luxturna® (Spark Therapeutics / Novartis), Zolgensma® (AveXis / Novartis), Roctavian® (BioMarin), Hemgenix® (CSL Behring), Upstaza® (PTC Therapeutics)) and 5 LVV therapies (Kymriah® (Novartis), Zynteglo® (Blubird Bio), Breyanzi® (Bristol Meyer Squibb), Abecma® (Bristol Meyer Squibb & Bluebird Bio) and Lipmeldy® (Orchard Therapeutics)), have been marketed. Growth forecasts for both vectors differ as a function of assumptions used, but sources agree that an annual market growth ~15–20% can be expected at least until 2030 [2]Adeno-associated virus vector manufacturing market. Grand View Research, San Francisco, 2022. [3]GlobalNewswire. AAV Contract Development And Manufacturing Organizations Market Report 2023: Robust Pipeline of Adeno-Associated Virus for Gene Therapies and Vaccines Boosts Growth. Research and Markets, Dublin, 2023 [4]Future Market Insights. Viral Vector Development Market. Future Market Insights, Newark, 2023 [5]Spherical Insights. Global Lentiviral Vectors Market Size to grow USD 829 Million by 2030. Spherical Insights, Mason, 2022 [6]Persistence Market Research. Lentiviral Vectors Market. Persistence Market Research, New York, 2022 which is in line with the expected doubling in gene therapy market approvals in the next few years [1]Alliance for Regenerative Medicine. Regenerative Medicine: The Pipeline Momentum Builds. Alliance for Regenerative Medicine, 2022Alliance for Regenerative Medicine. Regenerative Medicine: The Pipeline Momentum Builds. Alliance for Regenerative Medicine, 2022.
The popularity of AAVs and LVVs can be explained by their efficacy at delivering genes. AAV’s low toxicity and the availability of several natural AAV serotypes offering broad tropism properties make them especially suited for in-vivo use. On the other hand, LVV’s ability to deliver larger payloads and target immune and stem cells make them especially suited to ex-vivo cell therapy [7]Perry C, Rayat ACME. Lentiviral Vector Bioprocessing. Viruses 2021; 13(2), 268.. To this day, marketed AAV therapies are for in-vivo use only whereas marketed LVV therapies are for ex-vivo uses only, although several in-vivo applications are currently in the clinical pipeline with the latter (e.g., [8]Nicolas CT, VanLith CJ, Hickey RD et al. In vivo lentiviral vector gene therapy to cure hereditary tyrosinemia type 1 and prevent development of precancerous and cancerous lesions. Nat. Commun. 2022; 13(1), 5012. [9]Somaiah N, Block MS, Kim JW et al. First-in-Class, First-in-Human Study Evaluating LV305, a Dendritic-Cell Tropic Lentiviral Vector, in Sarcoma and Other Solid Tumors Expressing NY-ESO-1. Clin. Cancer Res. 2019; 25(19), 5808–5817. [10]Annoni A, Cantore A, Della Valle P et al. Liver gene therapy by lentiviral vectors reverses anti-factor IX pre-existing immunity in haemophilic mice. EMBO Mol. Med. 2013; 5(11), 1684–1697.).
Physico-chemical properties & supernatant expression level dictates bioprocessing choices
AAVs and LVVs are fundamentally quite different from one another: AAVs are small (20–25 nm diameter), non-enveloped ssDNA viruses that carry a relatively small transgene (~4.7 kb) [11]Hebben M. Downstream bioprocessing of AAV vectors: industrial challenges & regulatory requirements. Cell Gene Ther. Insights, 2018; 4(2), 131–146.. There are 11 known naturally-occurring serotypes, which do not cause any known human diseases. The degree of extra-cellular viral release depends on the serotype, but cell lysis is most of the time required to recover the viral vectors. Although relatively stable compared to other viruses at room temperature and physiological pH, active (full) AAVs are co-expressed during cell culture with non-functional AAV viral capsids (partially filled or empty) which must be removed during downstream processing.
Traditionally density gradient ultra-centrifugation has been employed to remove empty capsids, which is costly, time-consuming, and not currently scalable using single-use technologies. More recently, chromatographic techniques have demonstrated capability to remove empty capsids [12]Dickerson R, Argento C, Pieracci J, Bakhshayeshi M. Separating Empty and Full Recombinant Adeno-Associated Virus Particles Using Isocratic Anion Exchange Chromatography. Biotechnol. J. 2021; 16(1), e2000015.. Additionally, AAV particles tend to stick to cell debris and some plastic materials which further adds to the recovery challenge [13]Ramy S, Ueda Y, Nakajima H, Hiroi M, Hiroi Y, Torisu T, Uchiyama S. Reduction of Recombinant Adeno-Associated Virus Vector Adsorption on Solid Surfaces by Polyionic Hydrophilic Complex Coating. J. Pharm. Sci. 2022; 111(3), 663–671. [14]Srivastava A, Mallela KMG, Deorkar N, Brophy G. Manufacturing Challenges and Rational Formulation Development for AAV Viral Vectors. J. Pharm. Sci. 2021; 110(7), 2609–2624. [15]Wright JF, Le T, Prado J et al. Identification of factors that contribute to recombinant AAV2 particle aggregation and methods to prevent its occurrence during vector purification and formulation. Mol. Ther. 2005; 12(1), 171–178.. Finally, they must be concentrated several-fold for final formulation, making the removal of impurities a particular challenge as they can co-concentrate with the product [11]Hebben M. Downstream bioprocessing of AAV vectors: industrial challenges & regulatory requirements. Cell Gene Ther. Insights, 2018; 4(2), 131–146..
LVVs, on the other hand, are much larger (80–100 nm diameter) enveloped ssRNA viruses carrying a larger transgene (up to 10 kb) [16]Kalidasan V, Ng WH, Ishola OA, Ravichantar N, Tan JJ, Das KT. A guide in lentiviral vector production for hard-to-transfect cells, using cardiac-derived c-kit expressing cells as a model system. Sci. Rep. 2021; 11(1), 19265. which naturally buds from cells into the supernatant upon maturing, which means that lysis is not required to recover them. Compared to AAVs, LVVs display poor stability: they degrade quickly at room temperature and with exposure to shear forces, salt and pH gradients [7]Perry C, Rayat ACME. Lentiviral Vector Bioprocessing. Viruses 2021; 13(2), 268. which causes their downstream recovery yields to be typically in the range of 30% and lower.
Current technology choices cannot fully meet demand
By far the most common production method both for AAVs and LVVs is additive-based triple-transfection (mediated by lipid (e.g., Lipofectamine™) or polymers (e.g., polyethyleneimine) complexes or simpler chemicals (calcium phosphate)) in HEK293 cell lines, although packaging (containing some of the required recombinant genetic material) or producer cell lines (containing all of the required recombinant genetic material) are being developed. The transfection process has drawbacks as Good Manufacturing Practice-grade plasmid DNA is very costly [17]Comisel RM, Kara B, Fiesser FH and Farid SS. Lentiviral vector bioprocess economics for cell and gene therapy commercialization. Biochem. Eng. J. 2021; 167. and the process itself is delicate to execute and scale [18]Young H, Probert P. Development and scale-up of suspension culture processes for viral vector manufacturing: challenges and considerations. Cell Gene Ther. Insights 2020; 6(1) 149–157, but for the time being it is generally accepted as the most convenient solution available. For AAVs, production with baculovirus or herpes simplex virus (HSV) helpers is also possible but less exploited today [11]Hebben M. Downstream bioprocessing of AAV vectors: industrial challenges & regulatory requirements. Cell Gene Ther. Insights, 2018; 4(2), 131–146.. The HEK293 cell line is originally adherent but growing it in this manner usually requires serum, which brings regulatory, supply and cost constraints. Furthermore, adherent culture requires scalable bioprocessing solutions for high demand applications. Manual adherent technology such as multi-tray dishes are acceptable for very low production scales (e.g., Leber congenital amaurosis (LCA) or aromatic l-amino acid decarboxylase deficiency (AADC)); yet developers are steadily moving to suspension processes using suspension HEK293 cell lines and single-use stirred-tank bioreactors (SUBs), as these are perceived as a more suitable solution to reach higher throughputs and economies of scale. However, high-volume bioreactors alone are not sufficient to meet the demands of high dose or high prevalence diseases such as spinal muscular atrophy (SMA), cystic fibrosis or hemophilia (Figure 1 Disease prevalence and dose size for selected (A) AAV- and (B) LVV-based therapies. In the bubble plot, the bubble size is proportional to vector quantity requirement relative to the disease prevalence. The annual demand is computed by multiplying the dose size with an estimation of the yearly number of patients to receive the therapy (1 dose per patient). To estimate the size and number of batches required to meet the demand, the following is used: for LVV, an average titer of 1×10⁸ TU/mL and 30% DSP yield is assumed. For AAV, an average titer of 5×10¹⁰ vg/ mL and 40% DSP is assumed. In both cases a cell density at transfection of 1×10⁶ cells/mL is assumed. If available the yearly number of patients to receive therapy is used; elsewhere, it is estimated using the disease prevalence with a maximum of 10,000 patients per year.ALL: Acute lymphoblastic lymphoma; AADC: atic l-amino acid decarboxylase deficiency; LCA: Leber congenital amaurosis; SCID: Severe cross-linked combined immunodeficiency; LPLD: Lipoprotein lipase deficiency; SMA: Spinal muscular atrophy).
Though theoretical, this exercise uses real-world data and highlights that unless innovation brings significant improvements to existing processes and technologies, some therapies are doomed to remain excessively expensive or even impossible to produce in sufficient quantities to treat the patients who need it. Some relatively recent examples illustrate this: Kymriah (Novartis), a chimeric antigen receptor (CAR)-T autologous cell therapy against acute lymphoblastic lymphoma, was priced at $475,000 in the US and is estimated to have a cost of goods (CoG) per dose in the region of $100,000–$200,000 [19]Cumbers J. Why Some Drugs Cost $2.1 Million Per Dose And How One Company Plans To Change This. Forbes, 2021, or Zolgensma (Novartis), an AAV-9 systemic injection therapy against SMA, priced at $2.1 million (cost of goods unknown) [20]Zhang JH, Shan LL, Liang F, Du CY, Li JJ. Strategies and Considerations for Improving Recombinant Antibody Production and Quality in Chinese Hamster Ovary Cells. Front. Bioeng. Biotechnol. 2022; 10, 856049..
One of the basic assumptions in calculations, such as the ones used to generate the data in Figure 1, is the achievable production titer and the downstream yields of the target vector. While improving the latter is helpful, some of the more impactful ways to achieve the required throughput cost effectively are to significantly increase the viral productivity per unit volume either by increasing the cell-specific productivity (the antibody industry did it 100–200-fold over 40 years) or by increasing the total number of cells per unit volume.
The move to suspension alleviates some pains but creates others
For this purpose, SUBs provide large scale options which help reduce production costs with scale and automation and enable the removal of serum from the process thanks to suspension cells. However, having little evolved since their introduction several decades ago, they also suffer from basic design limitations, detailed here below, which makes scale-up of the cell culture conditions, transfection and other process steps, such as lysis for AAV, challenging especially at scales above 200 L (Univercells Technologies’ observation from individual conversations with contract development and manufacturing organizations (CDMOs) and developers in North America, Europe and Asia as well as cell and gene therapy conference material in 2020–2022). Indeed, it is difficult but important to maintain homogeneous conditions during the scale-up above 200 L while minimizing shear, especially for shear sensitive processes such as during the transfection step (because DNA/polymer polyplexes are highly shear sensitive) and when producing LVVs which quickly degrade when exposed to higher shear forces [7]Perry C, Rayat ACME. Lentiviral Vector Bioprocessing. Viruses 2021; 13(2), 268.. Another limitation is that increasing the cell density is possible but requires an additional cell retention device, adding to cost and complexity. It is not currently possible to exceed cell concentrations above 2–4 million cells/mL without causing aggregation and therefore drops in cell-specific productivity, which is why most transfections are done at densities ~1–2 million cells/mL [22]ThermoFisher Scientific. Factors Influencing Transfection Efficiency (Accessed March 2023). [23]Leinonen HM, Lepola S, Lipponen EM et al. Benchmarking of Scale-X Bioreactor System in Lentiviral and Adenoviral Vector Production. Hum. Gene Ther. 2020; 31(5–6), 376–384.. Additionally, STRs are not designed for easy media exchange and washing steps, which are desirable for transfection-based processes. STRs also generate one large bulk harvest volume that contains both the product and cell culture impurities, such as debris, DNA, Host Cell Proteins (HCPs), etc., especially for processes requiring in-situ lysis like most AAV serotypes. Consequently, downstream process unit operations must be sized accordingly to handle the large bulk harvest volume
produced by STRs.
Cell culture needs a paradigm shift
As an alternative, single-use fixed-bed bioreactors embody a paradigm shift in bioprocessing by adapting the technology to the cells as opposed to the other way around. There are two types of fixed-bed bioreactors: the first generation packed (i.e., non-structured) bed bioreactors (PFBs), such as the iCELLis® from Pall, the BioBLU® with packed-bed Fibra-Cel® basket from Eppendorf and the TideXCell® from Cesco Bioengineering, and the novel second generation structured fixed-bed bioreactor (SFBs) such as the scale-X range. Originally developed to provide a scalable solution for adherent cells, PFB bioreactors have shown limitations probably due to the random (and variable) packing nature of the bed leading to inhomogeneities in cell and media distribution and resulting in difficulties in scale-up in dropping productivities at scale [24]Siedler L, Kasper F. Lentivirus production study in the scale-X™ fixed-bed bioreactor. Univercells Technologies, Nivelles , 2023. . This scalability limitation is addressed with the structured fixed-bed, designed to provide a homogeneous environment for cell growth regardless of size, where cells and media are evenly distributed throughout the fixed-bed, leading to consistently higher productivity (up to ten-fold increases reported for LVV [25]Kremer M, Perreira Chilima T. An Innovative Platform for Integrated Continuous Viral Vector Production in International Society Cell & Gene Therapy , San Francisco, 2022. compared to a packed bed, two-fold higher relative a SUB [26]Duyck M, Dohogne Y, Lievrouw R et al. Scalable, high performance single-use bioreactor technology for viral vectors production in European Society for Cell & Gene Therapy, Barcelona, 2019. , four-fold for AAV [27]Chatel A, Drugmand JC. AAV manufacturing: The benefits of growing serum-free, suspension HEK293 cells in the scale-X™ fixed-bed bioreactor. Univercells Technologies, Nivelles, 2023 compared to a packed-bed bioreactor, and three-fold compared to an SUB [28]Chatel A, Siedler L. AAV manufacturing: the benefits of growing serum-free, suspension HEK293 cells in the scale-X fixed-bed bioreactor (webinar), Univercells Technologies, 2023 .
The scale-X structured fixed-bed technology is a novel solution for suspension & adherent cells
The scale-X range features several scales for development, clinical and commercial production (scale-X hydro bioreactor is 2.4 m² of growth surface, scale-X carbo bioreactor is 10 or 30 m² and scale-X nitro bioreactor is 200 or 600 m²) and the larger bioreactor can grow at least as many cells as a 2,000 L bioreactor but at a fraction of the working volume (the scale-X nitro bioreactor vessel is 60 L). An additional benefit of SFBs is their suitability to grow both adherent and suspension cell lines, which not only addresses the worries about reliance on serum but also enables the simplification of adherence-dependent seed trains, which can be operationally burdensome at larger scale. Nonetheless, for adherent processes, technologies exist today (e.g., the scale-X™ cell collect module) that enable the recovery of cells from a smaller SFB to seed a larger one, thereby also simplifying the process. Finally, the scale-X range further reduces the process footprint by integrating in-line clarification and concentration, resulting in an automated platform that combines several process steps in one.
For AAV production, where most processes require in-situ lysis, the combination of the low bioreactor volume and cell immobilization means that wash steps can be introduced in the process, enabling the development of advanced harvest procedures that retain many cell impurities (debris, DNA, proteins) while collecting the AAV product. Additionally, the product can be recovered highly concentrated as it is released via lysis within a bioreactor vessel volume, thereby simplifying and reducing the footprint of downstream processing (DSP) operations. For LVV, a budding virus, biomass immobilization enables the development of perfusion harvest protocol without the need of an external cell retention device and allows collection of the production fraction at conditions which prevent product degradation (e.g., at 4 °C). Going one step further towards intensification, the NevoLine™ Upstream system integrates clarification and in-line concentration with the scale-X nitro bioreactor, in such a way that the harvest material containing the product can be clarified and concentrated further in-line without needing additional processing equipment. The result is a highly concentrated harvest, a fraction of the volume generated by an equivalent SUB process, and with less cell culture impurities such as HCP and DNA [29]Mahal H, Branton H, Farid SS. End-to-end continuous bioprocessing: Impact on facility design, cost of goods, and cost of development for monoclonal antibodies. Biotechnol. Bioeng. 2021; 118(9), 3468–3485..
Cost of goods modelling helps informed decision making for bioprocessing technology selection
The following case study aims to explore the impact of technology choice between SUBs, PFBs and SFBs on the drug substance cost of goods (COG) per dose. Evaluating the impact of different technology options on the cost of goods requires decision-support tools capable of simulating the process economics. The department of Biochemical Engineering at University College London has built decisional tools that offer valuable insights regarding the cost-competitiveness of different technologies, their cost drivers and process bottlenecks. They have been developed and used across a range of product modalities, from antibody-based biologics (e.g., [30]Lyle A, Stamatis C, Linke T, Hulley M, Schmelzer A, Turner R, Farid SS. Process economics evaluation and optimization of adeno-associated virus downstream processing. Biotechnol. Bioeng. 2023) to viral vectors (e.g., [17]Comisel RM, Kara B, Fiesser FH and Farid SS. Lentiviral vector bioprocess economics for cell and gene therapy commercialization. Biochem. Eng. J. 2021; 167. [31]Simaria AS, Hassan S, Varadaraju H et al. Allogeneic cell therapy bioprocess economics and optimization: single-use cell expansion technologies. Biotechnol. Bioeng. 2014; 111(1), 69–83.), mesenchymal stem cells [32]Hassan S, Simaria AS, Varadaraju H, Gupta S, Warren K, Farid SS. Allogeneic cell therapy bioprocess economics and optimization: downstream processing decisions. Regen. Med. 2015; 10(5), 591–609. [33]Chilima TPMF, Farid S. Impact of allogeneic stem cell manufacturing decisions on cost of goods, process robustness and reimbursement. Biochem. Eng. J. 2018; 137, 132–151. [34]Hassan S, Huang H, Warren K et al. Process change evaluation framework for allogeneic cell therapies: impact on drug development and commercialization. Regen. Med. 2016; 11(3), 287–305. [35]Jenkins M, Bilsland JAT, Ho S, Farid S. Patient-specific hiPSC bioprocessing for drug screening: bioprocess. Biochem. Eng. J. 2016;108, 84–97. , induced pluripotent stem cells [36]Jenkins M, Farid SS. Cost-effective bioprocess design for the manufacture of allogeneic CAR-T cell therapies using a decisional tool with multi-attribute decision-making analysis. Biochem. Eng. J. 2018; 137, 192–204., chimeric antigen receptor T cells [37]Mendonça da Silva J, Stamatis C, Chalmers SA, Erro E, Selden C, Farid SS. Decisional tool for cost of goods analysis of bioartificial liver devices for routine clinical use. Cytother. 2021; 23(8), 683–693. and bioartificial liver devices [38]Authorship & Conflict of Interest, but no study has yet compared the fixed-bed technology with traditional SUBs. The following details the method and assumptions used in the model and follows to demonstrate the impact of technology choice for the COG.
Material & methods
Material: cost of goods modelling tool overview
To perform a COG analysis for the different viral vectors (AAVs & LVVs), a process economics model developed in the Department of Biochemical Engineering, University College London [17]Comisel RM, Kara B, Fiesser FH and Farid SS. Lentiviral vector bioprocess economics for cell and gene therapy commercialization. Biochem. Eng. J. 2021; 167. [31]Simaria AS, Hassan S, Varadaraju H et al. Allogeneic cell therapy bioprocess economics and optimization: single-use cell expansion technologies. Biotechnol. Bioeng. 2014; 111(1), 69–83., was extended to incorporate the scale-X technology platform. The modelling tool integrates bioprocessing costs (upstream and downstream reagents buffers, labor, consumables, QC testing and indirect costs) but for this study does not include fill-finish; the information given in this paper refers to drug substance. User inputs to the model are bioprocessing data (e.g., expression titers, downstream processing yields), equipment footprints and the cost of resources. A list of inputs and assumptions for the model is available in previously published work [17]Comisel RM, Kara B, Fiesser FH and Farid SS. Lentiviral vector bioprocess economics for cell and gene therapy commercialization. Biochem. Eng. J. 2021; 167. [31]Simaria AS, Hassan S, Varadaraju H et al. Allogeneic cell therapy bioprocess economics and optimization: single-use cell expansion technologies. Biotechnol. Bioeng. 2014; 111(1), 69–83..
The model was developed in Python™ (v3.6) and operated through Jupyter Notebook (v5.2.2). A simulation started using the scenario inputs specified in Jupyter Notebook to perform the mass balance, equipment sizing and resources consumption calculations and to determine the COG per dose for each viral vector. The results were stored in a Microsoft Excel spreadsheet for further analysis and visualization. Figure 2 Schematic illustration of the process economics model.COG: Cost of goods; FCI: Fixed capital investment; QC: Quality control. represents a schematic illustration of the basic structure of the process economics model.
Method: scenario analysis formulation
The main objective of this study was to compare the cost-effectiveness of different production platforms including a traditional single-use stirred-tank bioreactor (batch-mode operation), a first generation packed fixed-bed bioreactor and the combination of scale-X cell collect module with the NevoLine Upstream platform for the manufacture of viral vectors (batch mode for AAV, perfusion for LVV). Figure 3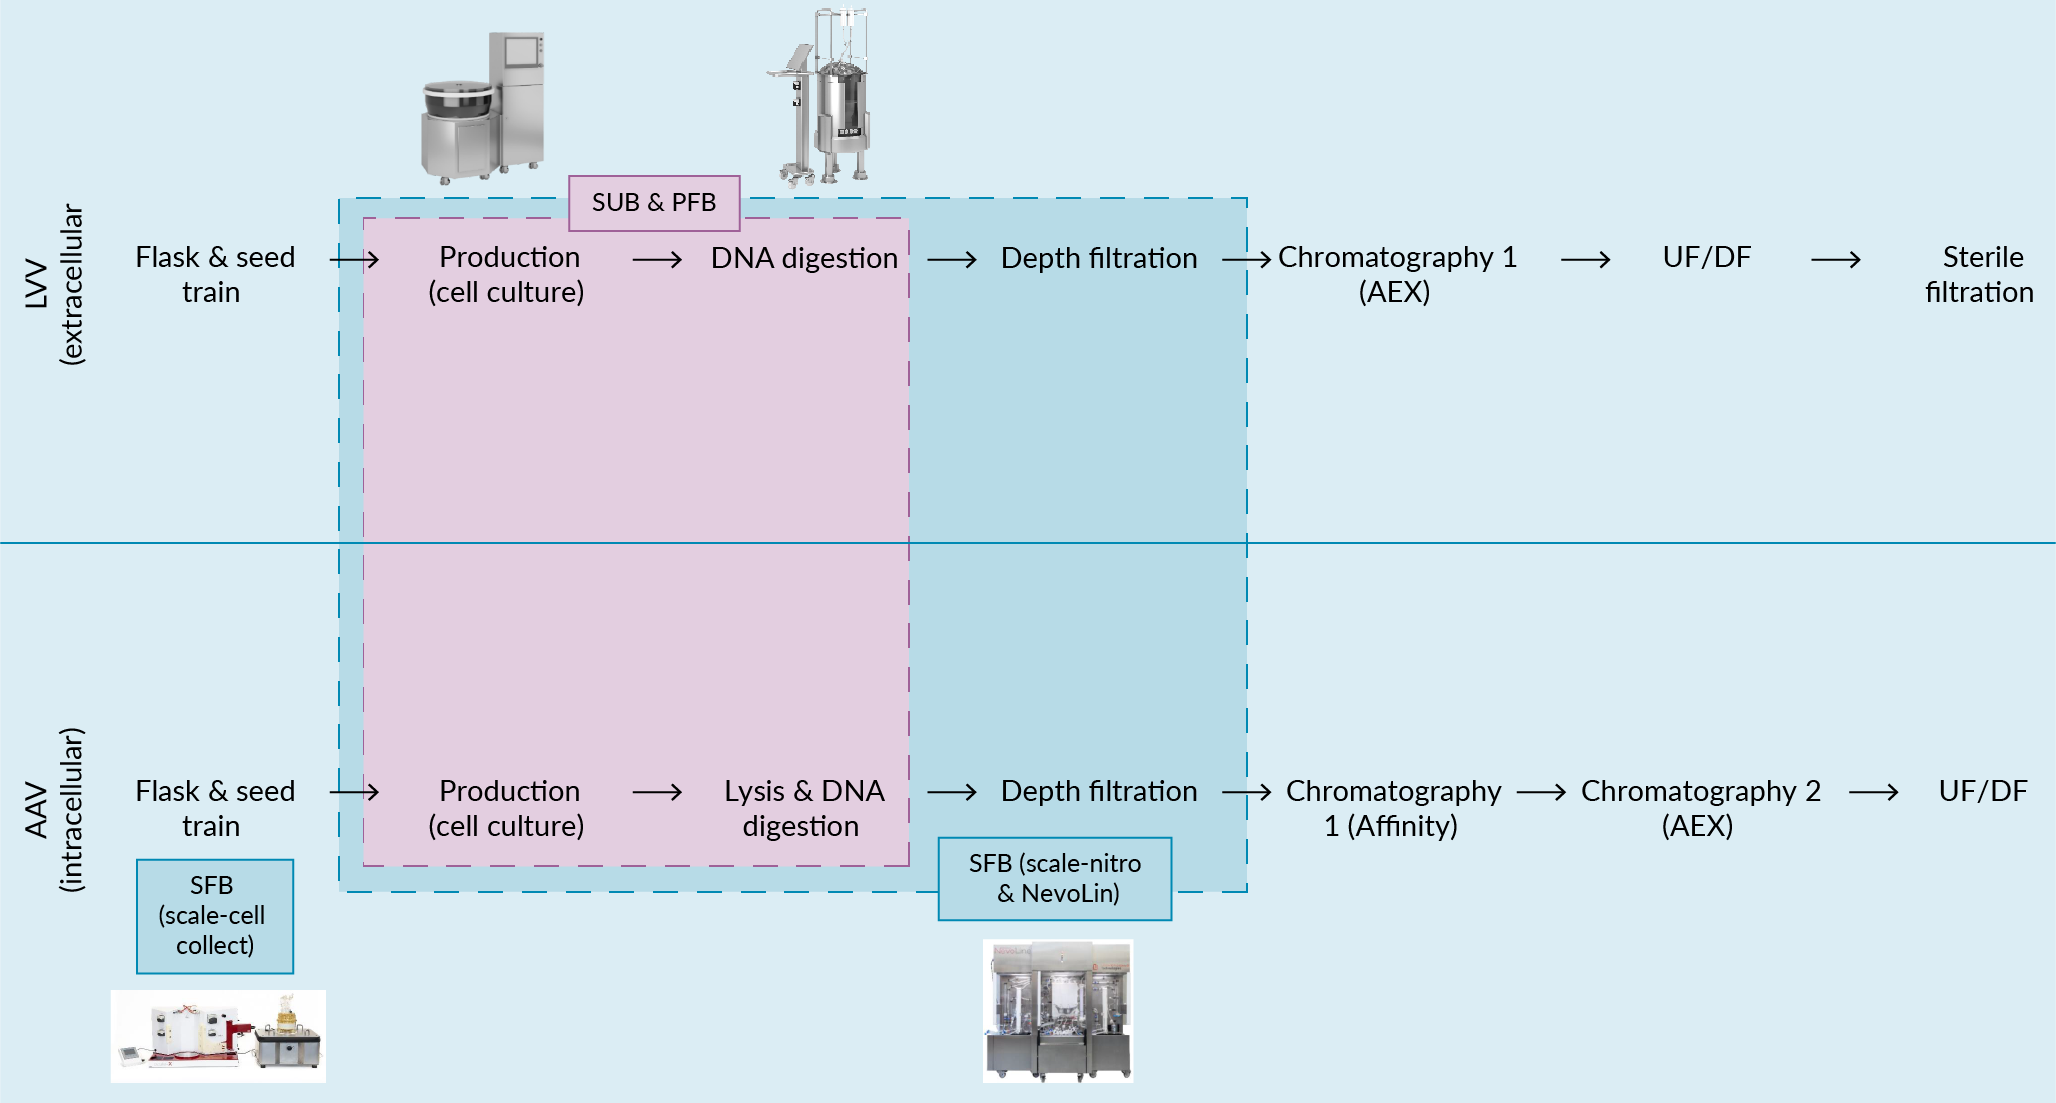 AAV and LVV process flow diagram. In the model presented in this paper, production (cell culture, virus production) and harvest treatment (DNA digestion) take place inside the production bioreactor in all cases. For the SFB, mid-stream clarification is an additional step that takes place in-line inside the NevoLine platform and the inoculum for the production bioreactor is prepared in the scale-X cell collect modules shows the process flowsheets for LVVs and AAVs and across manufacturing platforms considered in this study. Additionally, key assumptions related to the manufacturing process in each different platform is summarized in Table 1.
| Table 1 Summary of the key process assumptions for the AAV and LVV products COG model. | ||||||
| AAV | LVV | |||||
| SUB | PFB | SFB (scale-X™ nitro & NevoLine Upstream) | SUB | PFB | SFB (scale-X™ nitro & NevoLine Upstream) | |
| Transfection cell density (106 cells/mL for SUB or cm² for PFB/SFB ) | 1 | 0.35 | 0.35 | 1 | 0.35 | 0.35 |
| Cell specific productivity (vg/cell or TU/cell) | 10,000 | 10,000 | 20,000 | 10 | 10 | 20 |
| Media consumption (mL/106 cells) | 1 | 1 | 1 | 1 | 1 | 1 |
| DNA concentration (μg/106 cells) | 2 | 2 | 2 | 2 | 2 | 2 |
| Depth filter capacity (L/m²) | 50 | 300 | 300 | 50 | 300 | 300 |
| AAV: Adeno-associated virus; COG: Cost of goods; LVV: Lentiviruses; PFB: packed (i.e., non-structured) bed bioreactors; SFB: structured fixed-bed bioreactor; SUB: stirred-tank bioreactors. | ||||||
The scenario analysis investigated a range of annual vector demands (driven by 500–10,000 patients per year) and dose sizes for both LVVs (108–1012 TU/dose) and AAVs (1011–1015 vg/dose). For each demand-dose permutation, a scale analysis was performed for each manufacturing platform to identify the one with the lowest COG/dose. Furthermore, the scales leading to the minimum COG/dose for the three manufacturing platforms were compared to determine the most cost-effective platform for each demand-dose permutation.
A key difference among the manufacturing platforms that were considered in this study is the cell-specific productivity, where the base case is a two-fold increase in the scale-X SFB compared to both the PFB and the SUB. This is a reasonable and conservative assumption based on results referenced in the first section of this paper. Additionally, to account for the cell retention achieved by design in the fixed-bed bioreactors (both the PFB and the SFB), a clarification filter capacity six times higher is assumed in both cases compared to the SUB. Finally, a sensitivity analysis was performed to evaluate the cost-competitiveness of scale-X bioreactors and NevoLine Upstream platform across a range of cell specific productivities.
For all scenarios, the model is constrained to limit the number of parallel production lines to maximum 20, and over-production (i.e., the difference between viral vector quantity per batch and the requirement established at any given permutation of demand and dose size) to be lower than 30% in all cases. In the scenarios ‘NS’ is given as an output when no solution exists that meets the imposed batch number and over-production constraints.
Results & discussion
Table 2 shows the outcome of the first scenario analysis that demonstrates which scale produces the lowest COG/dose for each dose size and demand permutation. Dictated by economies of scale as demand and dose size increase, the scale leading to the lower COG/dose increases as well. What is observed is that it is mostly the dose size, and not the demand, which drives the need for scale-up, which reflects the fact that dose sizes vary 10,000-fold across therapeutic target, whereas demand only varies 20-fold between high and low scenarios.
| Table 2 Scale analysis for SUB, PFB, SFB across demand and doses sizes for AAV and LVV. The number that follows the technology acronym signifies the scale (in L for SUB and in m² for the PFB & SFB). NS means that there is no solution within the technologies used here (either the technology is too large and leads to overproduction, or capacity cannot be met with less than 20 production lines parallel) | |||||||||||
| AAV | LV | ||||||||||
| Dose size (vg) | Dose size (TU) | ||||||||||
| 1×10¹¹ | 1×10¹² | 1×10¹³ | 1×10¹⁴ | 1×10¹⁵ | 1×10⁸ | 1×10⁹ | 1×10¹⁰ | 1×10¹¹ | 1×10¹² | ||
| Demand (doses/y) | 500 | NS | SUB-50 | SUB-50 | SUB-500 | SUB-2000 | NS | SUB-50 | SUB-250 | SUB-1000 | SUB-2000 |
| 1,000 | NS | SUB-50 | SUB-250 | SUB-1000 | SUB-2000 | NS | SUB-50 | SUB-250 | SUB-2000 | SUB-2000 | |
| 2,000 | NS | SUB-50 | SUB-250 | SUB-2000 | SUB-2000 | SUB-50 | SUB-50 | SUB-500 | SUB-2000 | SUB-2000 | |
| 5,000 | SUB-50 | SUB-50 | SUB-500 | SUB-2000 | NS | SUB-50 | SUB-250 | SUB-1000 | SUB-2000 | NS | |
| 10,000 | SUB-50 | SUB-250 | SUB-1000 | SUB-2000 | NS | SUB-50 | SUB-250 | SUB-2000 | SUB-2000 | NS | |
| 500 | NS | PFB-66 | PFB-100 | PFB-500 | PFB-500 | NS | PFB-100 | PFB-100 | PFB-500 | PFB-500 | |
| 1,000 | NS | PFB-100 | PFB-100 | PFB-500 | PFB-500 | NS | PFB-66 | PFB-100 | PFB-500 | PFB-500 | |
| 2,000 | NS | PFB-100 | PFB-100 | PFB-500 | PFB-500 | NS | PFB-66 | PFB-200 | PFB-500 | PFB-500 | |
| 5,000 | PFB-66 | PFB-100 | PFB-500 | PFB-500 | NS | PFB-66 | PFB-100 | PFB-500 | PFB-500 | NS | |
| 10,000 | PFB-100 | PFB-100 | PFB-500 | PFB-500 | NS | PFB-66 | PFB-100 | PFB-500 | PFB-500 | NS | |
| 500 | NS | SFB-30 | SFB-30 | SFB-200 | SFB-600 | NS | SFB-10 | SFB-30 | SFB-600 | SFB-600 | |
| 1,000 | NS | SFB-30 | SFB-30 | SFB-600 | SFB-600 | SFB-10 | SFB-30 | SFB-30 | SFB-600 | SFB-600 | |
| 2,000 | SFB-10 | SFB-30 | SFB-30 | SFB-600 | SFB-600 | SFB-10 | SFB-30 | SFB-200 | SFB-600 | SFB-600 | |
| 5,000 | SFB-10 | SFB-30 | SFB-200 | SFB-600 | SFB-600 | SFB-10 | SFB-30 | SFB-600 | SFB-600 | SFB-600 | |
| 10,000 | SFB-10 | SFB-30 | SFB-600 | SFB-600 | NS | SFB-10 | SFB-30 | SFB-600 | SFB-600 | NS | |
| AAV: Adeno-associated virus; LVV: Lentiviruses; PFB: packed (i.e., non-structured) bed bioreactors; SFB: structured fixed-bed bioreactor; SUB: stirred-tank bioreactors. | |||||||||||
Table 3 shows the relative savings in COG/dose achieved if using the SFB compared to SUB and PFB for each dose/demand permutation. Firstly, looking at the design space, at low demand and dose size permutations the technologies selected here do not offer a solution (in the model the smallest scale considered for the scale-X technology is scale-X carbo 10 m² bioreactor), or in other words the bioreactor is simply too large and over-production exceeds 30%. In such cases, the more economical solution is likely a number of multi-tray dishes, as shown in Figure 1. Likewise, at the edges of high demand and high dose sizes, no feasible solution exists as the number of parallel production lines would exceed 20 to deliver the required throughput. Nonetheless, the SFB addresses cost-effectively some of the high demand and high dose combinations relative to both SUB and PFB. Additionally, and interestingly the SFB is the only technology that can actually achieve the demand in some of these extremities. At the lower end of doses and demand, this is thanks to the smaller scale of the SFB (10 or 30 m²) relative the smaller PFB available (66 m²). At the higher end, this is because the SFB is the only technology able to deliver the throughput required.
| Table 3 Analysis of the SFB COG/dose relative to SUB and PFB across demands and dose sizes and for AAV and LVV. In this figure, when ‘SFB’ appears in table, this indicates that this is the only technology that addresses the combination of dose and demand given the constraints. NS means no solution exists at the given conditions | |||||||||||
| SFB relative to SUB | SFB relative to PFB | ||||||||||
| AAV: Dose size (vg) | |||||||||||
| 1×10¹¹ | 1×10¹² | 1×10¹³ | 1×10¹⁴ | 1×10¹⁵ | 1×10¹¹ | 1×10¹² | 1×10¹³ | 1×10¹⁴ | 1×10¹⁵ | ||
| Demand (doses/y) | 500 | NS | −30% | −31% | −25% | −46% | NS | −33% | −32% | −20% | −36% |
| 1,000 | NS | −30% | −33% | −29% | −49% | NS | −33% | −32% | −21% | −42% | |
| 2,000 | SFB | −30% | −33% | −35% | −52% | SFB | −33% | −31% | −41% | −46% | |
| 5,000 | −30% | −31% | −25% | −46% | SFB | −33% | −32% | −20% | −36% | SFB | |
| 10,000 | −30% | −33% | −29% | −49% | NS | −33% | −32% | −21% | −42% | NS | |
| LVV: Dose size (TU) | |||||||||||
| 1×10⁸ | 1×10⁹ | 1×10¹⁰ | 1×10¹¹ | 1×10¹² | 1×10⁸ | 1×10⁹ | 1×10¹⁰ | 1×10¹¹ | 1×10¹² | ||
| 500 | NS | −25% | −32% | −35% | −60% | NS | −29% | −29% | −23% | −50% | |
| 1,000 | SFB | −26% | −33% | −45% | −61% | SFB | −29% | −29% | −31% | −49% | |
| 2,000 | −24% | −27% | −24% | −57% | −61% | SFB | −29% | −18% | −45% | −50% | |
| 5,000 | −24% | −32% | −35% | −60% | SFB | −34% | −29% | −23% | −50% | SFB | |
| 10,000 | −24% | −33% | −45% | −61% | NS | −31% | −30% | −31% | −49% | NS | |
| AAV: Adeno-associated virus; COG: Cost of goods; LVV: Lentiviruses; PFB: packed (i.e., non-structured) bed bioreactors; SFB: structured fixed-bed bioreactor; SUB: stirred-tank bioreactors. | |||||||||||
Secondly, looking at the extent of COG reduction, for AAV therapy, the SFB shows a COG/dose reduction ranging −25% to −52% relative to SUB and −20% to −46% relative to PFB. For LVV therapy, this ranges from −24% to −61% relative to SUB and −18% to −50% relative to PFB. Looking in more detail, at low doses (1×10¹¹–1×10¹² vg/mL for AAV and 1×10⁸–1×10⁹ TU/mL for LVV) increasing the demand has little to no impact on the COG/dose difference between technologies as, at this scale, all bioreactors have enough capacity to cover the demand. As the dose size increases, there starts to be a more significant impact of increasing demand on COG. The dip in COG/dose reduction observed at mid-dose sizes (1×10¹³–1×10¹⁴ vg/mL for AAV and 1×10¹⁰–1×10¹¹ TU/mL for LVV) can be explained by the scale jump between the medium capacity scale-X carbo bioreactor (30 m² in this case) and the production size scale-X nitro bioreactor (200 m² in this instance), which is a 6.7-fold increase relative to the smaller gap between SUB sizes (maximum two-fold between sizes) and the PFB sizes (maximum 1.7-fold). While the SUB and PFBs offer smaller step increases in scale, the SFB still offers a significant COG/dose reduction for all permutations while offering scales that cover a wide range of demands. Importantly too, the scale-X bioreactor family is the only fixed-bed technology that offers production capacity at mid-scale with bioreactors in the 10–30 m² range.
Deep-diving into individual cost drivers for the COG, Figure 4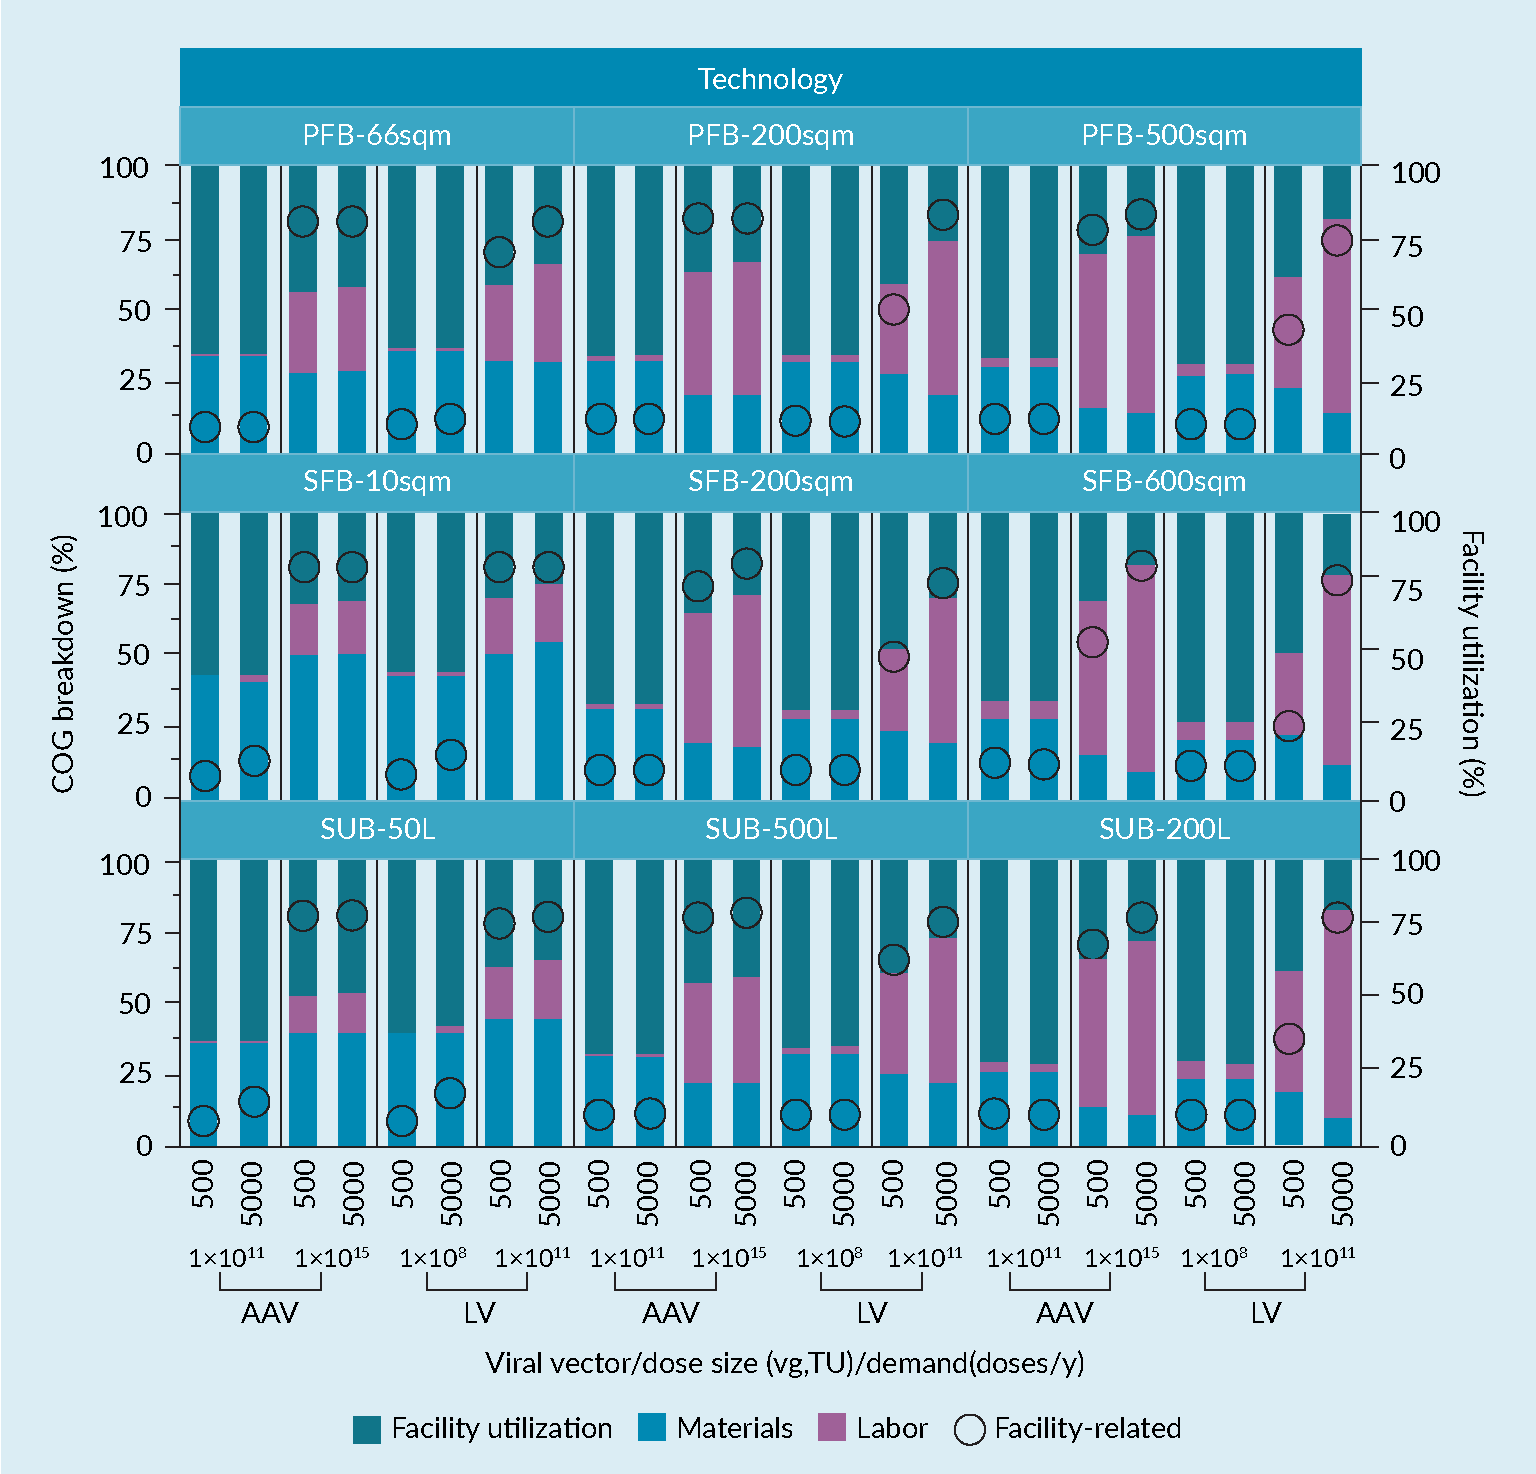 Analysis of the COG/dose breakdown (in labour, material and facility related contributions) and facility utilization rate for the three production technologies, at low and high dose and demand combinations, all for both AAV and LVV products details the labor, materials and facility-related contributions as well as the facility utilization rate. Generally, it is observed that at low dose and low demand, the facility-related costs drive the COG, followed by labor. As demand (and therefore throughput) increases, the material cost contribution increases, too. The scale of production has a more significant impact on the ranking of COG contributor at high dose sizes, while at low dose sizes scaling-up would not change the ranking of the COG drivers. Conversely and as a consequence of the scale-effect at high doses, a scale-up would change the ranking of COG drivers with materials now driving the cost followed by facility-related contributors. Finally, the facility utilization rate is expectedly low at low demand and increases with the dose size, although it must be noted that increasing the dose size has a more significant impact on utilization rate. There is no significant difference in this trend across technologies, with marginal benefits for the SFB at high dose size and demand combination and at the largest scale.
As a final step in this study, a sensitivity analysis was conducted to determine the relative impact of productivity on the COG differences between technologies. For this, two simulations were run where the productivity assumptions for SFB (two-fold increase relative to other technologies–see material and methods) was either reduced to 1.5-fold increase or to no increase relative to the PFB and SUB. The key observation here is that even at reduced cell-specific productivity, the scale-X SFB remains the most cost-effective manufacturing platform. As shown in Table 4, starting with the 25% reduction in cell specific productivity (i.e., ×1.5), both the results and trends are similar to what has been observed in Table 3 with a small reduction in the COG benefit across both vectors, which is expected (for AAV: −23% to −40% relative to SUB and −20% to −36% relative to PFB; for LVV: −25% to −51% relative to SUB and −19% to -36% relative to PFB). Dropping the productivity by 50% (or if productivity is equal across all platforms i.e., ×1), the COG reduction is still in the range of up to ~30% at a low dose and demand combination, but at the higher end of the spectrum, the differences are no longer significant across platforms. The conclusion from this sensitivity study is that cell-specific productivity is a key differentiator across technologies, but that even at equivalent performances fixed-bed technology provides cost advantages compared to SUB, although it must be considered that this will be sensitive to cell density at transfection as well as the ability to maintain titers during scale-up.
| Table 4 Sensitivity on cell specific productivity for the UTEC system. The ×1 and ×1.5 conditions refer to the relative increase in SFB cell−specific productivity relative to SUB or PFB. As for Table 3, NS means that no solution is available for the given conditions. SFB, SUB or PFB in a box means that the cited technology is the only one that can address the specific combination of dose and demand | |||||||||||||
| SFB relative to SUB | SFB relative to PFB | ||||||||||||
| Dose size (vg) | |||||||||||||
| 1×10¹¹ | 1×10¹² | 1×10¹³ | 1×10¹⁴ | 1×10¹⁵ | 1×10¹¹ | 1×10¹² | 1×10¹³ | 1×10¹⁴ | 1×10¹⁵ | ||||
| Fold increase in SFB cell specific productivity relative to SUB & PFB | ×1 | Demand (doses/y) | 500 | NS | −31% | −29% | −18% | −13% | NS | −35% | −30% | −12% | 4% |
| 1000 | SFB | −31% | −28% | −17% | −10% | SFB | −34% | −26% | −7% | 1% | |||
| 2000 | SFB | −31% | −19% | −13% | −9% | SFB | −33% | −17% | −20% | 2% | |||
| 5000 | −31% | −29% | −18% | −13% | NS | −35% | −30% | −12% | 4% | NS | |||
| 10000 | −31% | −28% | −17% | −10% | NS | −34% | −26% | −7% | 1% | NS | |||
| ×1.5 | 500 | NS | −31% | −32% | −25% | −40% | NS | −34% | −33% | −20% | −28% | ||
| 1000 | NS | −31% | −32% | −29% | −35% | NS | −34% | −30% | −21% | −27% | |||
| 2000 | NS | −31% | −23% | −30% | −38% | NS | −34% | −21% | −36% | −30% | |||
| 5000 | −31% | −31% | −25% | −40% | SFB | −35% | −33% | −20% | −28% | SFB | |||
| 10000 | −31% | −32% | −29% | −35% | NS | −34% | −30% | −21% | −27% | NS | |||
| SFB relative to SUB | SFB relative to PFB | ||||||||||||
| Dose size (TU) | |||||||||||||
| 1×10⁸ | 1×10⁹ | 1×10¹⁰ | 1×10¹¹ | 1×10¹² | 1×10⁸ | 1×10⁹ | 1×10¹⁰ | 1×10¹¹ | 1×10¹² | ||||
| Fold increase in SFB cell specific productivity relative to SUB & PFB | ×1 | Demand (doses/y) | 500 | NS | −26% | −26% | −25% | −26% | NS | −31% | −24% | −11% | −8% |
| 1000 | SFB | −26% | −18% | −26% | −26% | SFB | −30% | −14% | −7% | −4% | |||
| 2000 | −26% | −26% | −19% | −26% | SUB | SFB | −28% | −12% | −4% | PFB | |||
| 5000 | −26% | −27% | −25% | −26% | NS | −35% | −24% | −11% | −8% | NS | |||
| 10000 | −25% | −17% | −26% | −26% | NS | −32% | −13% | −8% | −4% | NS | |||
| ×1.5 | 500 | SFB | −27% | −30% | −35% | −48% | SFB | −31% | −28% | −23% | −35% | ||
| 1000 | SFB | −27% | −29% | −40% | −51% | SFB | −31% | −25% | −24% | −36% | |||
| 2000 | −27% | −28% | −25% | −51% | −51% | SFB | −30% | −19% | −37% | −36% | |||
| 5000 | −26% | −30% | −34% | −48% | NS | −36% | −28% | −23% | −35% | NS | |||
| 10000 | −26% | −29% | −40% | −51% | NS | −33% | −25% | −24% | −36% | NS | |||
| PFB: packed (i.e., non-structured) bed bioreactors; SFB: structured fixed-bed bioreactor; SUB: stirred-tank bioreactors. | |||||||||||||
Translational insights
Univercells Technologies has developed and commercialized the scale-X and NevoLine product range, which is an intensified and integrated cell culture and mid-stream processing platform for the manufacture of viral products. The study presented in this paper focused on evaluating the cost-competitiveness of the scale-X bioreactor family and NevoLine platform compared to other adherent (packed fixed-bed bioreactor) and suspension (single-use stirred-tank bioreactors) cell culture technologies across a range of dose sizes, annual demands and production scales for both LVV and AAV viral vectors. The results demonstrate a competitive advantage for the Univercells Technologies platform over other technologies with cost of goods benefits of −18 to −61% depending on the demand/dose range, the scale of production and the viral vector. Additionally, as a result of its enhanced productivity, reduced footprint and reduced complexity, the Univercells Technologies platform could offer greater facility operational flexibility and a better throughput compared to other adherent and suspension technologies. This is because reducing the number of batches needed per product could allow for a greater number of products to be accommodated in the same facility and thus a better utilization and distribution of the facility’s workforce and utilities. The affordability of cell and gene therapies is a problem that reduces access of life saving drugs to patients, but technological innovation such as the scale-X bioreactor family and NevoLine platform can help address the challenge by improving process efficiency and manufacturing throughput.
Biographies
Christos Stamatis is a research associate at the Future Targeted Healthcare Manufacturing Hub hosted at UCL Biochemical Engineering. He is focusing on the development of decisional tools for a range of therapeutic modalities. He is a co-founder and the managing director of Decisional Point Ltd.
Alex Chatel is a Senior Marketing & Product manager at Univercells Technologies, responsible for key developments and applications in the scale-X™ fixed-bed bioreactor technology. Prior to this, he held positions as an Enterprise Fellow at University College London, UK and as a Research Engineer at GlaxoSmithKline in Stevenage, UK. Alex has a broad bioprocessing expertise ranging from antibody products to viral vaccines and cell & gene therapies, both in upstream and downstream applications. Alex earned his PhD in Biochemical Engineering from University College London, UK and his MEng in Chemical Engineering from The University of Manchester, UK.
Suzanne Farid is Professor of Bioprocess Systems Engineering at the Department of Biochemical Engineering at University College London (UCL) and Deputy Head of Department (Education). She is Co-Director of the Future Targeted Healthcare Manufacturing Hub in collaboration with industrial and academic consortia to revolutionize the delivery of cost-effective targeted biotherapeutics to patients. She is also Director of the UCL-AstraZeneca Centre of Excellence. She leads research on ‘Decisional Tools’ to facilitate cost-effective bioprocess design, capacity planning, R&D portfolio management, root cause analysis and manufacturability assessments for biopharmaceuticals ranging from monoclonal antibodies to cell and gene therapies. She sits on the UK BioIndustry Association Manufacturing Advisory Committee and ISCT Business Models and Investment Sub Committee. She is a Fellow of the Royal Academy of Engineering (FREng) and a Fellow of Institution of Chemical Engineers (FIChemE). She is a co-founder of Decisional Point Ltd.
Affiliations
Christos Stamatis
Department of Biochemical Engineering,
Bernard Katz Building,
London WC1E 6BT
UK
Alex Chatel PhD
Univercells Technologies,
Chemin de la Vieille Cour 56a,
1400 Nivelles,
Belgium
Suzanne Farid
Department of Biochemical Engineering,
Bernard Katz Building,
London WC1E 6BT
United Kingdom
.png)
References
1. Alliance for Regenerative Medicine. Regenerative Medicine: The Pipeline Momentum Builds. Alliance for Regenerative Medicine, 2022. Crossref
2. Adeno-associated virus vector manufacturing market. Grand View Research, San Francisco, 2022. Crossref
3. GlobalNewswire. AAV Contract Development And Manufacturing Organizations Market Report 2023: Robust Pipeline of Adeno-Associated Virus for Gene Therapies and Vaccines Boosts Growth. Research and Markets, Dublin, 2023. Crossref
4. Future Market Insights. Viral Vector Development Market. Future Market Insights, Newark, 2023. Crossref
5. Spherical Insights. Global Lentiviral Vectors Market Size to grow USD 829 Million by 2030. Spherical Insights, Mason, 2022. Crossref
6. Persistence Market Research. Lentiviral Vectors Market. Persistence Market Research, New York, 2022. Crossref
7. Perry C, Rayat ACME. Lentiviral Vector Bioprocessing. Viruses 2021; 13(2), 268. Crossref
8. Nicolas CT, VanLith CJ, Hickey RD et al. In vivo lentiviral vector gene therapy to cure hereditary tyrosinemia type 1 and prevent development of precancerous and cancerous lesions. Nat. Commun. 2022; 13(1), 5012. Crossref
9. Somaiah N, Block MS, Kim JW et al. First-in-Class, First-in-Human Study Evaluating LV305, a Dendritic-Cell Tropic Lentiviral Vector, in Sarcoma and Other Solid Tumors Expressing NY-ESO-1. Clin. Cancer Res. 2019; 25(19), 5808–5817. Crossref
10. Annoni A, Cantore A, Della Valle P et al. Liver gene therapy by lentiviral vectors reverses anti-factor IX pre-existing immunity in haemophilic mice. EMBO Mol. Med. 2013; 5(11), 1684–1697. Crossref
11. Hebben M. Downstream bioprocessing of AAV vectors: industrial challenges & regulatory requirements. Cell Gene Ther. Insights, 2018; 4(2), 131–146. Crossref
12. Dickerson R, Argento C, Pieracci J, Bakhshayeshi M. Separating Empty and Full Recombinant Adeno-Associated Virus Particles Using Isocratic Anion Exchange Chromatography. Biotechnol. J. 2021; 16(1), e2000015. Crossref
13. Ramy S, Ueda Y, Nakajima H, Hiroi M, Hiroi Y, Torisu T, Uchiyama S. Reduction of Recombinant Adeno-Associated Virus Vector Adsorption on Solid Surfaces by Polyionic Hydrophilic Complex Coating. J. Pharm. Sci. 2022; 111(3), 663–671. Crossref
14. Srivastava A, Mallela KMG, Deorkar N, Brophy G. Manufacturing Challenges and Rational Formulation Development for AAV Viral Vectors. J. Pharm. Sci. 2021; 110(7), 2609–2624. Crossref
15. Wright JF, Le T, Prado J et al. Identification of factors that contribute to recombinant AAV2 particle aggregation and methods to prevent its occurrence during vector purification and formulation. Mol. Ther. 2005; 12(1), 171–178. Crossref
16. Kalidasan V, Ng WH, Ishola OA, Ravichantar N, Tan JJ, Das KT. A guide in lentiviral vector production for hard-to-transfect cells, using cardiac-derived c-kit expressing cells as a model system. Sci. Rep. 2021; 11(1), 19265. Crossref
17. Comisel RM, Kara B, Fiesser FH and Farid SS. Lentiviral vector bioprocess economics for cell and gene therapy commercialization. Biochem. Eng. J. 2021; 167. Crossref
18. Young H, Probert P. Development and scale-up of suspension culture processes for viral vector manufacturing: challenges and considerations. Cell Gene Ther. Insights 2020; 6(1) 149–157. Crossref
19. Cumbers J. Why Some Drugs Cost $2.1 Million Per Dose And How One Company Plans To Change This. Forbes, 2021. Crossref
20. Zhang JH, Shan LL, Liang F, Du CY, Li JJ. Strategies and Considerations for Improving Recombinant Antibody Production and Quality in Chinese Hamster Ovary Cells. Front. Bioeng. Biotechnol. 2022; 10, 856049. Crossref
21. Chahal PS, Schulze E, Tran R, Montes J, Kamen AA. Production of adeno-associated virus (AAV) serotypes by transient transfection of HEK293 cell suspension cultures for gene delivery. J. Virol. Meth. 2014; 196, 163–173. Crossref
22. ThermoFisher Scientific. Factors Influencing Transfection Efficiency (Accessed March 2023). Crossref
23. Leinonen HM, Lepola S, Lipponen EM et al. Benchmarking of Scale-X Bioreactor System in Lentiviral and Adenoviral Vector Production. Hum. Gene Ther. 2020; 31(5–6), 376–384. Crossref
24. Siedler L, Kasper F. Lentivirus production study in the scale-X™ fixed-bed bioreactor. Univercells Technologies, Nivelles , 2023. Crossref
25. Kremer M, Perreira Chilima T. An Innovative Platform for Integrated Continuous Viral Vector Production in International Society Cell & Gene Therapy , San Francisco, 2022. Crossref
26. Duyck M, Dohogne Y, Lievrouw R et al. Scalable, high performance single-use bioreactor technology for viral vectors production in European Society for Cell & Gene Therapy, Barcelona, 2019. Crossref
27. Chatel A, Drugmand JC. AAV manufacturing: The benefits of growing serum-free, suspension HEK293 cells in the scale-X™ fixed-bed bioreactor. Univercells Technologies, Nivelles, 2023. Crossref
28. Chatel A, Siedler L. AAV manufacturing: the benefits of growing serum-free, suspension HEK293 cells in the scale-X fixed-bed bioreactor (webinar), Univercells Technologies, 2023. Crossref
29. Mahal H, Branton H, Farid SS. End-to-end continuous bioprocessing: Impact on facility design, cost of goods, and cost of development for monoclonal antibodies. Biotechnol. Bioeng. 2021; 118(9), 3468–3485. Crossref
30. Lyle A, Stamatis C, Linke T, Hulley M, Schmelzer A, Turner R, Farid SS. Process economics evaluation and optimization of adeno-associated virus downstream processing. Biotechnol. Bioeng. 2023 Crossref
31. Simaria AS, Hassan S, Varadaraju H et al. Allogeneic cell therapy bioprocess economics and optimization: single-use cell expansion technologies. Biotechnol. Bioeng. 2014; 111(1), 69–83. Crossref
32. Hassan S, Simaria AS, Varadaraju H, Gupta S, Warren K, Farid SS. Allogeneic cell therapy bioprocess economics and optimization: downstream processing decisions. Regen. Med. 2015; 10(5), 591–609. Crossref
33. Chilima TPMF, Farid S. Impact of allogeneic stem cell manufacturing decisions on cost of goods, process robustness and reimbursement. Biochem. Eng. J. 2018; 137, 132–151. Crossref
34. Hassan S, Huang H, Warren K et al. Process change evaluation framework for allogeneic cell therapies: impact on drug development and commercialization. Regen. Med. 2016; 11(3), 287–305. Crossref
35. Jenkins M, Bilsland JAT, Ho S, Farid S. Patient-specific hiPSC bioprocessing for drug screening: bioprocess. Biochem. Eng. J. 2016;108, 84–97. Crossref
36. Jenkins M, Farid SS. Cost-effective bioprocess design for the manufacture of allogeneic CAR-T cell therapies using a decisional tool with multi-attribute decision-making analysis. Biochem. Eng. J. 2018; 137, 192–204. Crossref
37. Mendonça da Silva J, Stamatis C, Chalmers SA, Erro E, Selden C, Farid SS. Decisional tool for cost of goods analysis of bioartificial liver devices for routine clinical use. Cytother. 2021; 23(8), 683–693. Crossref
Authorship & Conflict of Interest
Contributions: All named authors take responsibility for the integrity of the work as a whole, and have given their approval for this version to be published.
Acknowledgements: Univercells Technologies would like to acknowledge the opportunity offered to its industrial consortium by the Future Targeted Healthcare Manufacturing Hub led by the department of Biochemical Engineering at University College London to perform this study.
Disclosure and potential conflicts of interest: The authors have no conflicts of interest.
Funding declaration: The authors received financial support for the research, authorship and/or publication of this article from the Future Targeted Healthcare Manufacturing Hub led by the department of biochemical engineering at University College London.
Article & copyright information
Copyright: Published by Cell and Gene Therapy Insights under Creative Commons License Deed CC BY NC ND 4.0 which allows anyone to copy, distribute, and transmit the article provided it is properly attributed in the manner specified below. No commercial use without permission.
Attribution: Copyright © 2023 Univercells Technologies. Published by Cell and Gene Therapy Insights Insights under Creative Commons License Deed CC BY NC ND 4.0.
Article source: Invited; externally peer reviewed.
Submitted for peer review: May 5, 2023; Revised manuscript received: Jun 9, 2023; Publication date: Jun 20, 2023.