Navigating the opportunities and challenges in analytical development of flowcytometry for T cell therapy
Cell & Gene Therapy Insights 2024; 10(10), 1305–1312
DOI: 10.18609/cgti.2024.149
T cell therapies are derived from autologous or allogeneic starting materials and target various diseases, including cancers, autoimmune diseases, and infectious diseases. This article highlights the rapid advancements in assay validation tools, focusing on flow cytometry as a crucial technique for analyzing T cell products. Understanding the intricacies of both T cell therapies and flow cytometry is essential for successful clinical and regulatory outcomes.
T cell therapies and flow cytometry: an overview
CAR-T cell therapies are generated from autologous or allogeneic starting material, sourced from patient or donor blood. A few autologous CAR-T cell products, such as Kymriah and Yescarta, target leukemia and lymphoma and are based on peripheral blood-derived T cells. Therapies utilizing tumor-infiltrating lymphocytes (TILs), TCR-T cells, and regulatory T cells are also being developed. With rapid advancements, clinical trials are exploring applications for these therapies in solid tumors, autoimmune diseases, and infectious diseases, such as HIV.
A comprehensive understanding of T cell-based starting materials and related validation processes is essential for successful IND submissions, and ultimately, enhanced patient outcomes. The autologous cell therapy process includes validation and quality control assessments at each step, as shown in the examples in Figure 1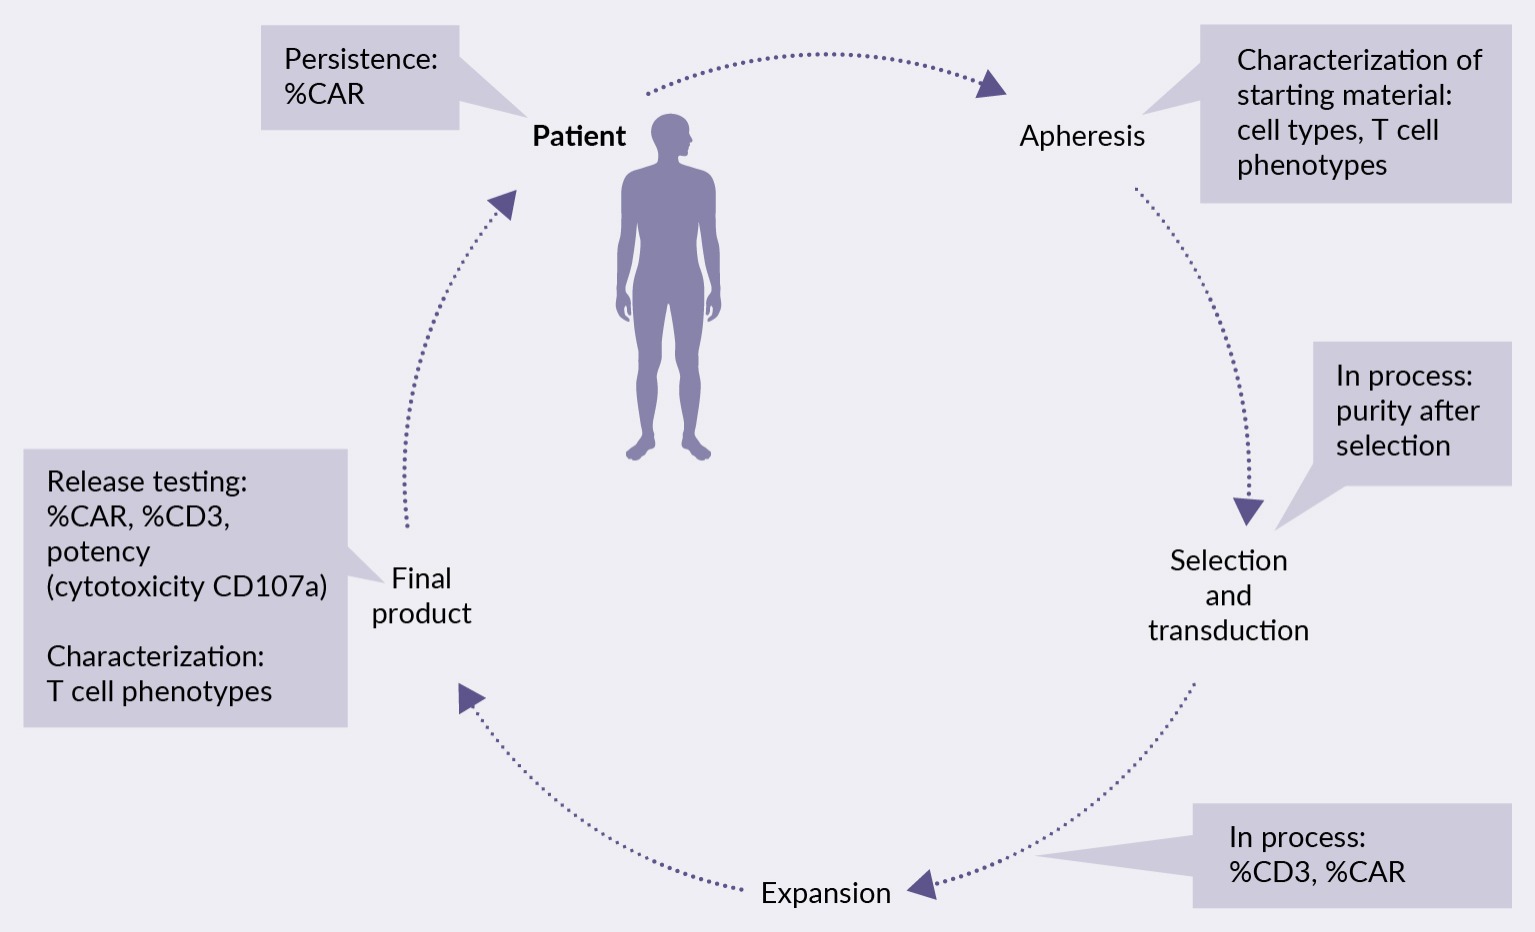 Utilization of flow cytometry process using selected tests at various points.. Following apheresis, for example, characterizing the starting material involves immunophenotyping various immune cell populations, particularly T cells. Subsequent purity assessments post-T cell isolation is necessary, and the qualification of %CD3 and %CAR is vital to ensure a quality therapeutic product. Release testing involves additional assessments for cytotoxicity and potency as per regulatory requirements.
Flow cytometry is used throughout the manufacturing process, from initial characterization to monitoring post-administration, as it provides detailed, quantitative, and multiparametric data on individual cells. This makes it an indispensable tool in the development, manufacturing, and quality control of cell-based therapies.
Challenges of using flow cytometry in assay validation and QC
Flow cytometry is a powerful analytical technique used to measure physical and chemical characteristics of cells or particles as they flow in a fluid stream through a laser beam. By labeling cells with fluorescent antibodies that bind to specific markers, flow cytometry can identify, quantify, and analyze multiple parameters on individual cells simultaneously, such as size, granularity, and protein expression. This multiparametric data provides a detailed profile of cell populations, allowing researchers to differentiate cell types, assess functions, and track changes in response to treatments. Due to its precision, speed, and capacity for high-throughput analysis, flow cytometry is essential in cell therapy, where understanding cellular behavior at an individual level is crucial for QC.
Despite its critical role, flow cytometry faces several challenges in cell therapy manufacturing, particularly in functional assays like proliferation, cytotoxicity, apoptosis, and cytokine release. One significant challenge is the lack of available reference materials, as assays must be scientifically sound and fit for purpose, especially in the early stages before pivotal trials.
Flow cytometry gating can involve some subjectivity, and precise instrument settings are required. Other challenges include nonspecific antibody binding, cellular autofluorescence, and the tendency of dying cells to interfere with results. These issues complicate the validation, qualification, and analysis of assays.
Determination of linearity is another challenge, as achieving 100% purity in cell populations is rare. Background noise varies between batches, making it difficult to set consistent limits of detection (LOD) and quantification (LOQ). Extensive work is required to evaluate each marker in every cell population within the panel.
Table 1 illustrates the parameters that should be determined during qualification and validation, highlighting specific challenges faced when assessing these parameters via flow cytometry.
| Table 1. Parameters requiring determination during the qualification and validation to address flow cytometry challenges. | ||
|---|---|---|
| Parameter | Definition | Challenge |
| Accuracy | Expresses the closeness of agreement between the value which is accepted either as a conventional true value or an accepted reference value and the value found | Lack of reference or standard |
| Specificity | Is the ability to assess unequivocally the analyte in the presence of component which may be expected to be present | Spike in specific cell populations for detection; heterogenic samples |
| Linearity and range | Linearity is the ability (within a given range) of an analytical procedure to obtain test results which are directly proportional to the concentration of analyte in the sample; the range is the interval between the upper and lower concentration of analyte which it has been demonstrated a suitable level of precision, accuracy, and linearity | Populations not being 100%, limits the assessment of the range; heterogenic sample with several different cell populations. |
| LOD, LOQ | LOD is the lowest amount of analyte in a sample which can be detected but not necessarily quantitated as an exact value LOQ is the lowest amount of analyte in a sample which can be quantitively determined with suitable precision and accuracy | Unspecific background which differ between samples |
| Precision | Expresses the closeness of agreement (degree of scatter) between a series of measurements obtained from multiple sampling of the same homogenous sample under prescribed conditions; is considered at three levels: repeatability, intermediate precision, and reproducibility | Cells are heterogenous and may have vial to vial variations in the populations, subjective gating, variability of instruments. |
| LOD: limit of detection, LOQ: limit of quantitation. | ||
Novel tools and approaches to support assay validation and QC via flow cytometry
To address these challenges, several innovative tools are available. Lyophilized peripheral blood mononuclear cells (PBMCs), for example, come with a certificate of analysis detailing predetermined percentages of different cell populations, supporting consistency across assay runs, if the same lot is used. Lot-to-lot variability is a significant challenge, as each batch of PBMCs can exhibit differences in cell composition, viability, and marker expression due to donor heterogeneity and variations in collection and processing. This variability impacts the reproducibility and accuracy of assays, requiring additional steps for standardization and rigorous QC to ensure consistent therapeutic performance across different production batches.
Fluorescent particles known as rainbow beads can be used to calibrate instruments and serve as controls. However, the fluorescence spectrum of rainbow beads might not perfectly match the spectrum of the fluorophores used in cell samples, leading to inaccuracies in compensation and calibration settings. Rainbow beads are also limited in their ability to mimic biological samples, which can impact light scatter properties. Finally, they may not respond to changes in instrument settings (e.g., voltage adjustments) in the same way as live cells, potentially introducing discrepancies when translating calibration results to real-world cell samples.
Cell mimics as a next-generation solution
Slingshot Biosciences employs a semiconductor-based manufacturing process to produce polymer-based cell mimics that accurately replicate essential cellular features, such as size, granularity, autofluorescence, and protein expression. These cell mimics are versatile and can be applied across all aspects of flow cytometry analysis, including instrument standardization, compensation, and assay control. With minimal lot-to-lot variability, scalable production, and a shelf life of up to 18 months, these mimics address the limitations of traditional solutions, providing scientists with a reliable and modern approach to overcoming challenges in flow cytometry analysis.
Antibody titrations using TruCytes™ CD8 cell mimics
One of the key challenges in flow cytometry is determining the optimal antibody concentration, as titrations are performed with the target cell type, which can vary across batches, especially with primary cells or autologous samples. TruCytes, from Slingshot Biosciences, are polymer-based particles with specific protein markers embedded on their surface, that can be tailored to mimic specific attributes of most cell types.
Figure 2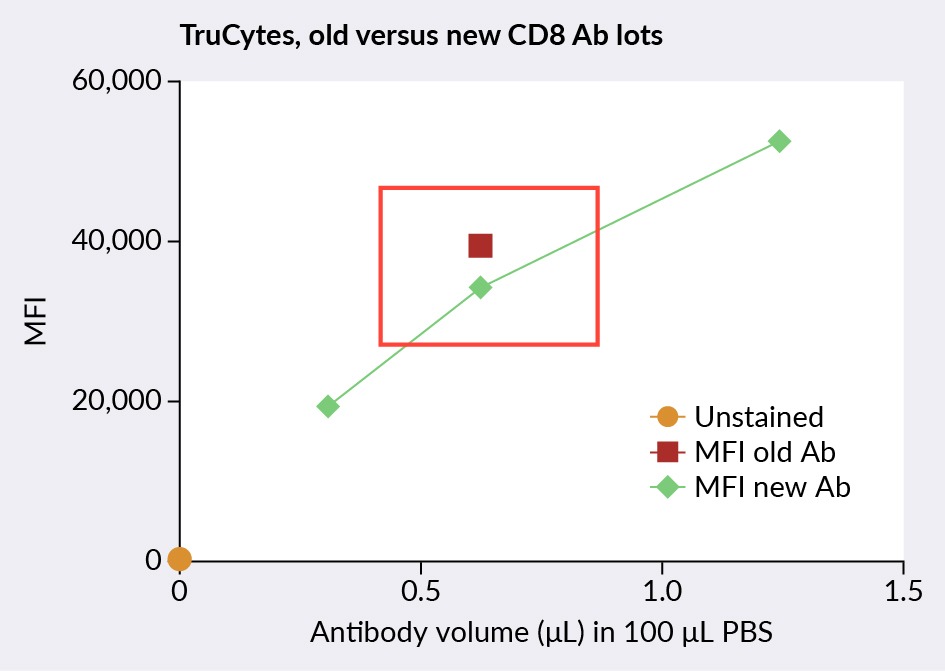 Comparison of TruCyte CD8 cell mimic titration of old and new CD8 antibodies.Ab: antibody, MFI: mean fluorescence intensity. compares old and new CD8 antibodies, titrated using TruCytes CD8 cell mimics. The red square and green diamonds represent the MFI (mean fluorescence intensity) of old CD8 antibodies and the MFI of new CD8 antibodies respectively. This was used to determine the old/new antibody MFI ratio (87%), indicating that the optimal dilution of the new antibody lot was 0.72/100. Of note, the first titration should be done on the same type of cells as the test samples; the following titrations of new lots can be done with the cell mimics for a standardized method of antibody titration.
Linearity and limit of flow cytometry quantification of HyParComp™ beads
Understanding the LOQ is another crucial component of flow cytometry assay validation, which represents the lowest reliable quantitative measurement. Linearity is typically assessed by fully diluting a sample to 0%. Finding an appropriate cell type for these dilutions can be challenging; and while cell lines are commonly used, they may not fully replicate the properties of lymphocytes.
HyParComp is a cell mimic designed for compensation and is provided in two vials: one with 100% positive beads and the other with 100% negative beads. HyParComp compensation mimics were used to measure assay linearity from 0–100% and determine the linear range.
The experiment used two approaches, as seen in Figure 3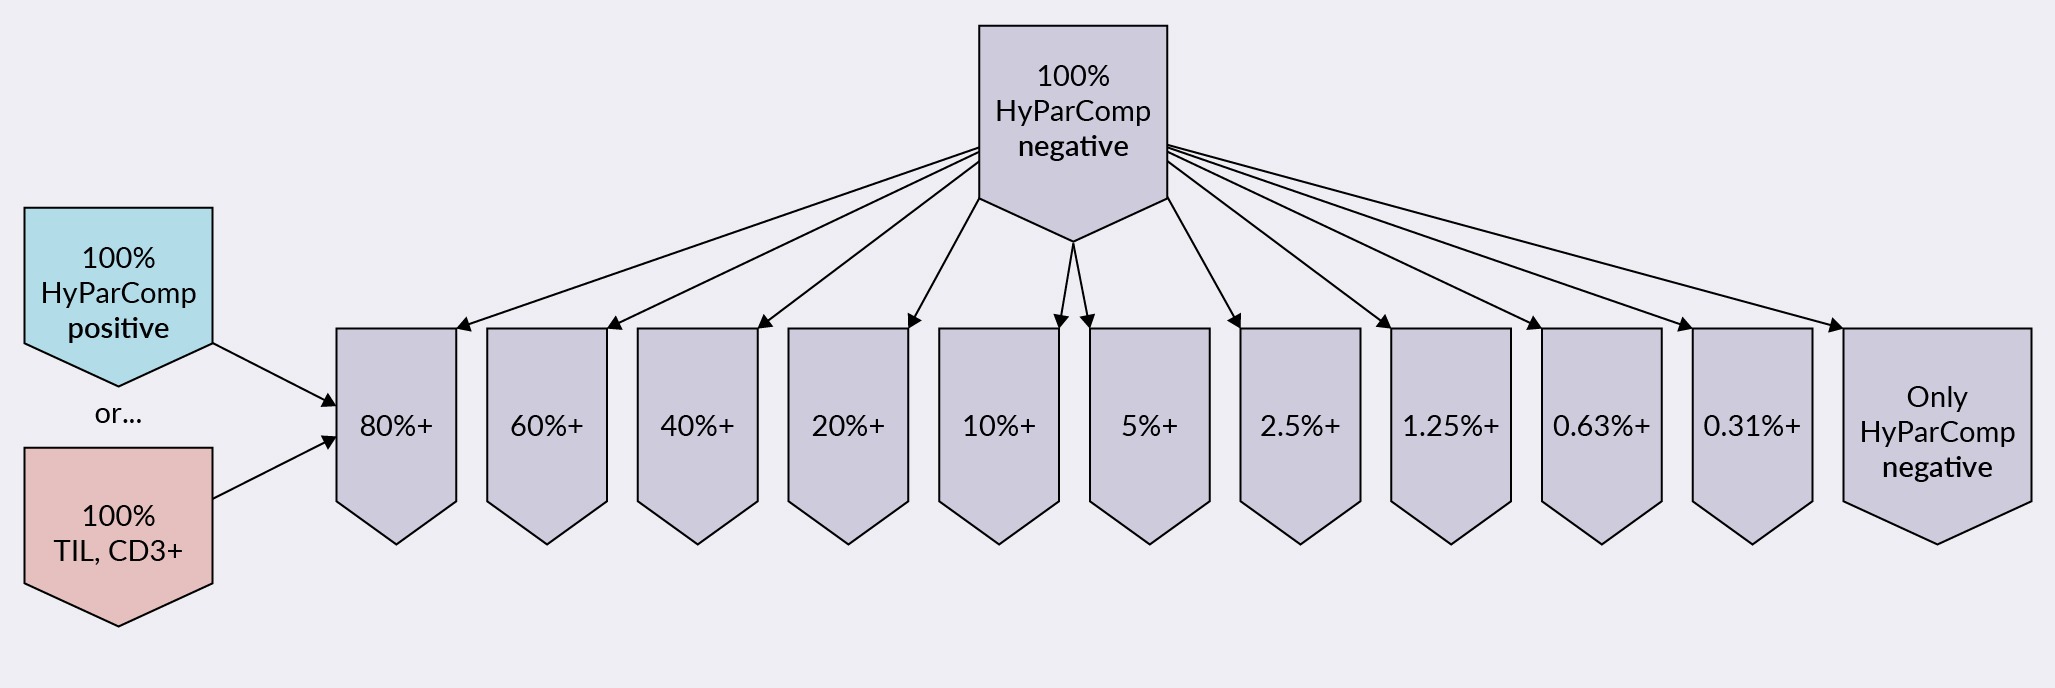 Experimental design of assessing linearity and LOQ of flow cytometry using HyParComp beads.LOQ: limit of quantitation, TIL: tumor-infiltrating lymphocyte.. In the first, TILs at 100% were diluted with negative HyParComp beads, or ‘naked beads’, from 80% down to 0%. In the second approach, 100% HyParComp positive beads, which bind all antibodies, were diluted similarly with the naked HyParComp beads.
This allowed for the assessment of linearity and LOQ, where the results are shown in Figure 4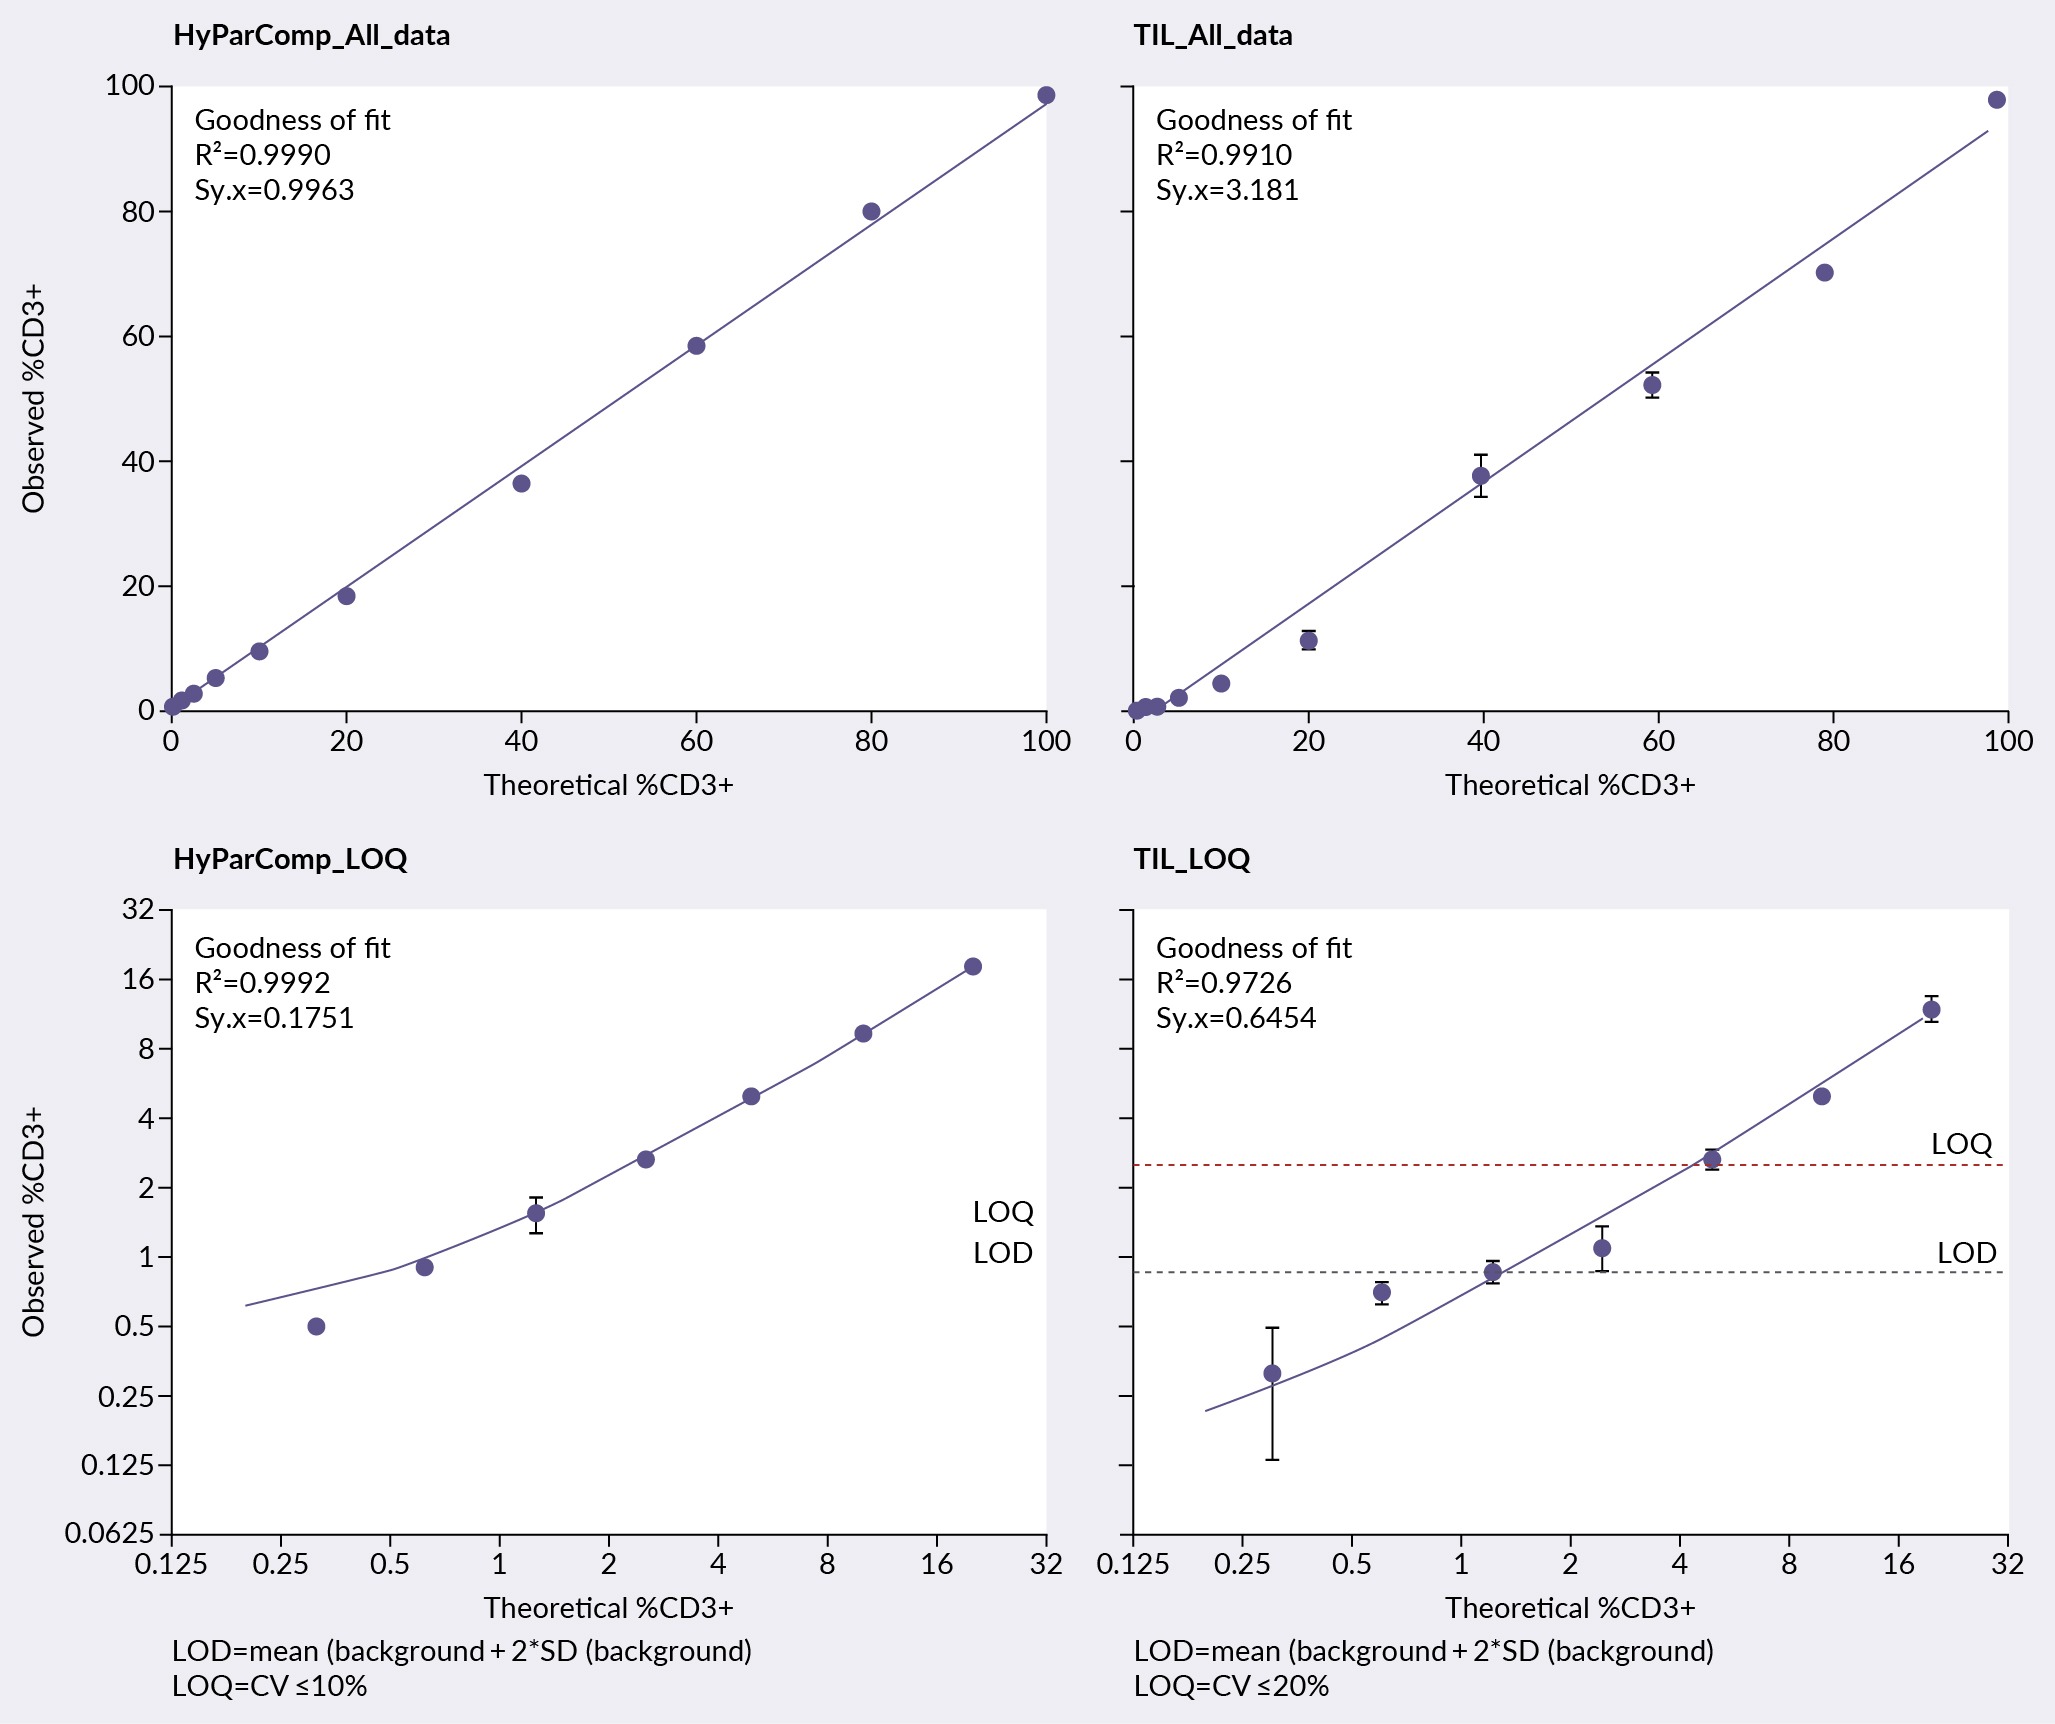 Linearity and limit of flow cytometry quantification of HyParComp beads and TIL cells.CV: cell viability, LOD: limit of detection, LOQ: limit of quantitation, TIL: tumor-infiltrating lymphocyte.. The upper graphs represent the linearity assessment across all concentrations, while the lower graphs focus on the 20 to 0% range for the LOQ assessment. The HyParComp beads demonstrated excellent linearity with an R-squared value of 0.999. TIL data showed some deviation with an R-squared value of 0.991.
HyParComp cell mimics showed consistent and clean results, with minimal variation across replicates a LOQ of just over 1%. In contrast, TILs displayed higher variability due to the non-uniform distribution of cells, resulting in higher cell viability (CV) percentage. For the TILs, a %CV of 20% was accepted, setting the LOQ around 3%.
Summary
Flow cytometry, a vial method in T cell therapy, faces many challenges including the need for precise assay validation and standardization, non-specific antibody binding, and subjectivity in gating. Novel approaches such as lyophilized PBMCs, cell mimics from Slingshot Biosciences, and automated instruments help address these challenges.
Affiliations
Therese Choquette
Head of Analytical and Translational Sciences,
Tigen Pharma,
Lausanne, Vaud, Switzerland
Minh Ngoc Duong
Senior Analytical Scientist,
Tigen Pharma,
Lausanne, Vaud, Switzerland
Authorship & Conflict of Interest
Contributions: The named author takes responsibility for the integrity of the work as a whole, and has given their approval for this version to be published.
Acknowledgements: None.
Disclosure and potential conflicts of interest: Slingshot Bio provided the Slingshot Bio material needed for the study free of charge (cell mimics and comp beads). All material besides this was purchased or provided by Tigen Pharma. Therese Choquette and Minh Ngoc Duong are employees of Tigen Pharma SA.
Funding declaration: Support was given for presenting at the Cell Therapy Analytical Development Summit, Boston, Dec 3–5, 2024.
Article & Copyright Information
Copyright: Published by Cell & Gene Therapy Insights under Creative Commons License Deed CC BY NC ND 4.0 which allows anyone to copy, distribute, and transmit the article provided it is properly attributed in the manner specified below. No commercial use without permission.
Attribution: Copyright © 2024 Slingshot Bio. Published by Cell & Gene Therapy Insights under Creative Commons License Deed CC BY NC ND 4.0.
Article source: This article is based on a webinar held by Slingshot Biosciences.
Revised manuscript received: Oct 14, 2024; Publication date: Nov 25, 2024.
