
Cell and gene therapy manufacturing: the necessity for a cost-based development approach
Cell Gene Therapy Insights 2016; 2(1), 115-120.
10.18609.cgti.2016.014
“Money does not grow on trees, but it does make the world go round!”
Whilst you don’t have to be a botanist to appreciate the first half of this statement, it is only the purest of physicists that will disagree with the latter. The world of drug development, of which cell and gene therapies currently represent the forefront of scientific, clinical and business activity, is an expensive undertaking (where money trees are few and far between). Moreover, global healthcare providers have never been under greater pressure to reduce expenditure in order to meet ever decreasing budgets and an ever increasing patient population. So, whilst addressing unmet clinical needs or improving clinical efficacy does and should remain the primary driver of novel cell and gene therapy development, the expense of implementing such therapies from a manufacturing, logistical and clinical perspective is coming under greater scrutiny and mounting importance – the era of cost-based development is upon us and is central to the approach of the Cell and Gene Therapy Catapult.
Published: Mar 21 2016
Reimbursement for cell and gene therapies is subject to value-based assessments and demonstration of their added-value over existing therapeutic alternatives (standard of care; best supportive care). By quantifying and monetizing the magnitude of the added value, the therapy’s reimbursed price potential can be determined. Deducting expected sales and logistic costs from this value, leaves the fraction of the pot from which the Cost of Goods (CoGs) and profit margin can be balanced. Companies expect to receive an appropriate level of return for successful drug products (and for funding those that didn’t make it all the way) and thus ultimately it is the CoGs that must be squeezed. If this is not suitably addressed, then as with the well referenced example of Provenge® (sipuleucel-T, Dendreon, USA), clinically successful products, coupled with a high CoGs that are not aligned with the reimbursed price potential of the product, can ultimately lead to an unsustainable business environment.
The Cell and Gene Therapy Catapult (CGT) is uniquely positioned to gain an insight and understanding of a range of processes across multiple indications with varying product formats. Consequently, it is possible to build an over-arching understanding of how different process development considerations can influence the manufacturing CoGs (and risk profiles) across multiple therapeutic sectors for the cell and gene therapy field. This has allowed CGT to build a framework of tools that can be employed to rank core process development considerations, interrogate them with respect to the parameters of uncertainty or their risk profile, and then subsequently correlate this to the CoGs output. Thereby gaining additional understanding of the commercial viability of the product and suitability of the manufacturing process from an economic perspective. This is demonstrated in the case study detailed within this article.
From the projects undertaken to date within CGT coupled with a broader understanding of the industry at large, we are beginning to build a data driven approach to understanding the key CoGs drivers.
In terms of Cost of Materials (CoM), a key driver for an ex vivo gene-modified product, is undoubtedly the requirement for GMP-grade viral vector. GMP-grade viral vector is currently incredibly expensive and typically accounts for over 60% of the CoM (and up to 50% of the CoGs). Thus, there is huge scope within the industry to drive down the costs of transduced cell therapy products through investing in the GMP viral vector manufacturing space and thereby facilitating a reduction in viral vector raw material costs. Other key drivers that may be prohibitive to reaching desired CoGs values include high value media and reagents, such as surface coatings and cytokines. In some processes, these can account for up to 80% of the CoGs. So likewise with the GMP vector, there is significant scope to reduce the CoGs through reduction in these raw materials costs, either by making the manufacturing processes for these products more efficient, or looking to switch to synthetic or small molecule alternatives that are already produced at a fraction of the cost.
Business plans should also include the expected expense of consumable and reagent commercial licence agreements; often “free” to use during clinical development, but require licensing post commercialisation. Thus, from a cost-based development approach, there are two options, one is to try and remove such products as early as possible from the development program, and focus on those materials where there is freedom to operate, or make a conscious decision to move forward with these materials to not delay getting to licensure and not have to carry the extra costs of developing work-around alternatives.
From a facility operations perspective the core drivers in reducing CoGs are labor- and throughput – (facility utilization) based. It is essential to maximize “value added” time within the facility, in other words, every hour of labor should be worth the investment. “Non-value added” time e.g., cells sitting in an incubator whilst no other processing is occurring, should be reduced as far as possible. Thus one of the key focal points we try to address in our process development plans is to close process operations so that they can be performed efficiently and swiftly within the manufacturing suite, then the next product can be processed as soon as possible thereafter. Inherently, by doing this, the maximum throughput should be naturally increased, by running parallel processes, which further drives down costs. Obviously, automation becomes a key enabler in such scenarios, however, the manner in which it is implemented is critical to its success. For autologous processes, where expensive items of automated kit are operated on a 1-kit-to-1-product basis, which in turn means the equipment is unable to be utilized for any other activities during production, the only way to increase throughput is through increased capital investment, which can be challenging to raise at the start of commercial ventures, whilst the market uptake is uncertain. In the allogeneic space, capital expenditure is sufficiently greater upfront due to the need for large-scale USP and DSP equipment, this can lead to a higher CoGs in the earlier years of production, especially if factors such as market demand or product shelf life mean that the level of facility utilisation required is reduced below maximum capacity. This becomes pertinent when scaling of manufacturing operations is based on the final expected market share, but the time to achieve this share is not factored into the manufacturing approach. Consequently, we can use our cost and throughput models to develop understanding into the best approach for staging increased levels of manufacturing capacity (e.g., recruitment and training of staff, capital expenditure etc) to minimise CoGs during the “start-up” years of production, prior to full capacity being achieved.
Finally, production failure rate can critically impact the true CoGs, as the cost of failed batches needs to be incorporated into those successful batches. In this article we define failed batches as those that can be directly attributed to a manufacturing failure e.g. contamination, operator error etc. Failures outside of the manufacturing facility, such as logistic failures, patient availability are not included. The lack of “platform” processes within the field means assessment of failure rate is highly challenging as they are very much process specific and a function of the degree of open processing, in-process controls and specification limits of the product CQAs. Thus tools as illustrated in the attached case study, become exceptionally valuable in understanding the process sensitivity to such uncertainties.
Case Study – Autologous Gene-modified immunotherapy
The CGT Cost Based Design toolkit, including a risk-based platform was utilized to identify a number of high risk or sub-optimized process steps for a market exemplar ex vivo viral gene-modified autologous T-cell immunotherapy. The result was the development of two alternative production processes. All three processes were evaluated in the context of our CoGs and throughput modelling approaches in order to conduct a comparative analysis of the process options. Moreover, each process was then subjected to a risk based modelling approach where probability distributions were replaced for high risk parameters in the model and the subsequent impact on the CoGs evaluated.
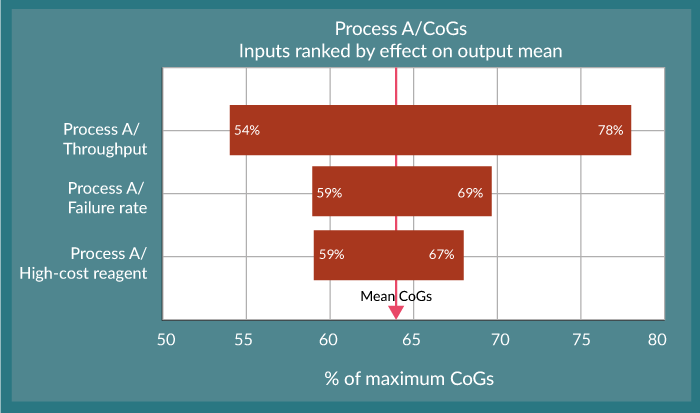
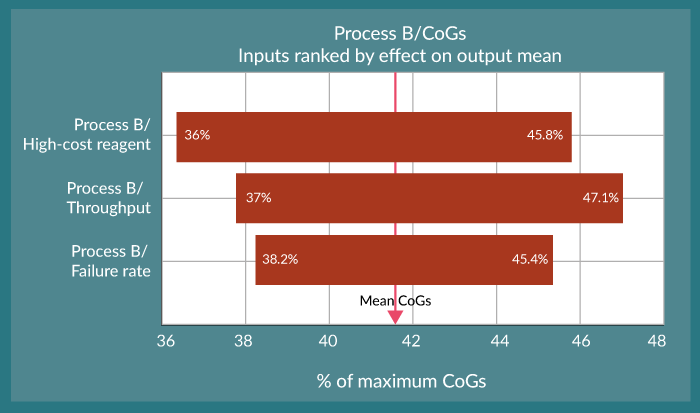
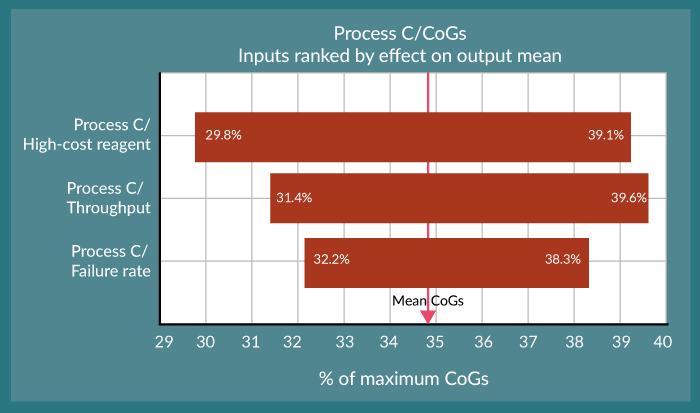
In this example, we have shown the impact of modelling three of these high risk parameters for each process:
- A high cost reagent whose usage is proportional to the volume of starting material (which can be variable from patient to patient).
- Negative variation from the maximum facility throughput as determined by our standard throughput modelling approach. e.g., reflective of slow uptake from the market.
- Quantification of the failure rate. Failure rate as a function of contamination, equipment failure etc are not easily defined for the new processes in relation to the de-risking achieved. Therefore a range of failure rates was explored.
Figure 1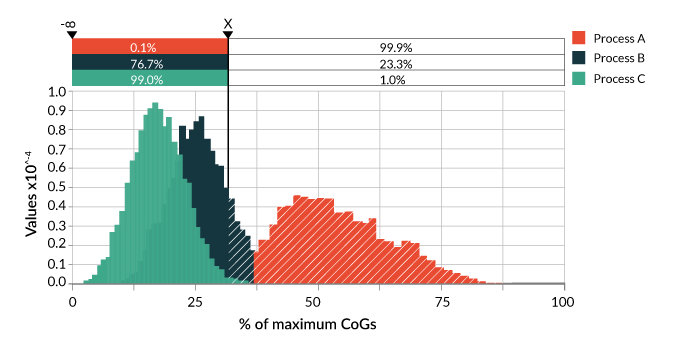
This type of analysis is very powerful and helps the user to begin to understand the potential variability in the cost of manufacturing their product. This is important from a pricing perspective as discussed at the outset of this article. For example, the reduction in CoGs for the optimised Process C, and with an assumed value for a viable commercial product “x” means we would meet this value 99% of the time. However, compared to the other processes, setting your CoGs at this limit would only account for 77% of the variability in process B and less than 1% for Process A (Figure 1), which in turn means that the expected positive nature of the balance sheet will be somewhat reduced. In this study, three input variables were chosen. The power of this model is that by coupling it to additional process risk analysis, impacts on CoGs can be determined for many more process inputs such as the effect of process yield, product strength and potency plus QC sample requirements.
The cell and gene therapy field has made great progress over recent years, as can be seen by the ever increasing number of clinical trials in this space, the increasing year on year investments and the handful of products that have made it through to commercialization. However, to ensure the long term success of the sector it will be essential that products can be delivered at a cost that is aligned with reimbursement price points to ensure that a win-win situation is created for all stakeholders. Therefore embracing a cost-based development approach will be critical in ensuring the full power of cell and gene therapy products can be unlocked…unless of course money starts growing on trees!
Financial & competing interests disclosure
Cell & Gene Therapy Catapult is an Innovate UK programme. The authors are employees of Cell and Gene Therapy Catapult. No writing assistance was utilized in the production of this manuscript.
Affiliations
Sarah Callens
Head of Process Development, Cell & Gene Therapy Catapult
Dr Jahid Hasan
Process Development Scientist, Cell & Gene Therapy Catapult
Dr Ryan McCoy
Senior Process Development Scientist, Cell & Gene Therapy Catapult
Dr Stephen Ward
Chief Operating Officer, Cell & Gene Therapy Catapult